
Smarter CPU Testing – How to Benchmark Kaby Lake & Haswell Memory Latency

This article originally appeared in Medium.
Modern CPUs are complex beasts with billions of transistors. This complexity in hardware brings indeterminacy even in simple software algorithms.
Let’s benchmark a simple list traversal.
Does the average node access latency correspond to say, a CPU cache latency?
Let’s test it!

Here we benchmark access latency for lists with a different number of nodes. All the lists are contiguous in memory, traversed sequentially, and have a 4 KB padding between the next pointers.
If we plot on the x-axis the working sets of benchmark iterations, and on the y-axis the node access latencies, how the graph will look on a modern CPU?

- The latency graph will have a few steps matching CPU caches specs.
- The graph will be steeper, and the latency much higher than the specs.
- The graph will be gradual, with no obvious steps.
The correct answer is at the very bottom of the article.
Modern CPUs Basics: Cache Hierarchy
Modern processors are fast, memory is slow. So CPUs have cache hierarchies:
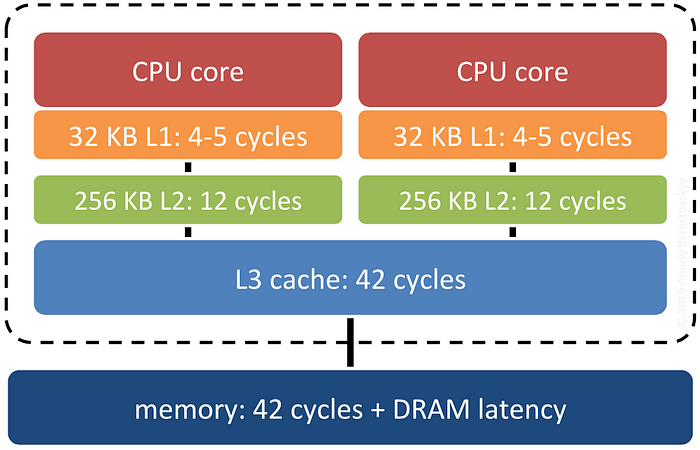
Once CPU tries to access a memory location, first it checks the level 1 cache. If the location is there, it’s an L1 “cache hit”. Otherwise, it’s an L1 “cache miss”, and CPU reaches for the next cache level, down to the memory.
The cache latencies depend on CPU clock speed, so in specs they are usually listed in cycles. To convert CPU cycles to nanoseconds:

For my laptop with Kaby Lake i7–7660U CPU running at 2.5GHz:
L1 cache hit latency:   5 cycles / 2.5 GHz = 2 ns
L2 cache hit latency:  12 cycles / 2.5 GHz = 4.8 ns
L3 cache hit latency:  42 cycles / 2.5 GHz = 16.8 ns
Memory access latency: L3 cache latency + DRAM latency = ~60-100 ns
Note: modern CPUs support frequency scaling, and DRAM latency greatly depends on its internal organization and timing. But those are minor details.
And one more thing. CPU loads and stores “cache lines” at a time, not bytes. For x86–64 CPUs the cache line size is 64 bytes, for A64 ARMs it’s 128 bytes. So even if we need to access just one byte, x86 CPU fetches at least 64.
Now we’re done with the basics and ready for the real stuff!
Benchmarking Intel Kaby Lake Memory Latency
Let’s benchmark memory latency by traversing lists with a different number of nodes. If the working set size of a traversal is less than level 1 cache, the node access latency will correspond to the L1 latency. If the working set is less than level 2 cache, the latency will correspond to the L2 cache, and so on.
List Nodes Padding
The devil is in the details. Remember CPU fetches cache lines, not bytes? Since the lists are contiguous, the adjacent nodes share the same cache line:

As we access the nodes sequentially, after each cache miss there are always a few cache hits within the same cache line. This will skew the average latency.
To avoid the cache hits, let’s add 4 KB padding to our ListNode struct:
// Memory page size. Default page size is 4 KB
const auto kPageSize = 4_KB;struct ListNode {
  ListNode *next;
  std::byte padding[kPageSize];
};
Note: we absolutely want smaller structures and more cache hits in our apps. Adding the padding is just a trick to avoid some CPU optimizations, so the memory access latency is not skewed.
But more on that later.
Working Set Size vs Number of Nodes
Traversing a list, each access to the next pointer fetches a cache line, so:
https://miro.medium.com/max/30/1*gLVNTVEE8rO8itPLFb5smQ.png?q=20


To plot the latency graph, the benchmark iterates over the different working sets, allocating corresponding number of list nodes for each iteration:
// Cache line size: 64 bytes for x86-64, 128 bytes for A64 ARMs
const auto kCachelineSize = 64_B;// Each memory access fetches a cache line
const auto num_nodes = mem_block_size / kCachelineSize;// Allocate a contiguous list of nodes for an iteration
std::vector<ListNode> list(num_nodes);
The List Traversal Benchmark
Let’s initialize the next pointers so they point to the adjacent nodes:
// Make a cycle of the list nodes
for (size_t i = 0; i < list.size() - 1; i++)
  list[i].next = &list[i + 1];
list[list.size() - 1].next = &list[0];
Now when we have our cyclic graph, the benchmark is trivial:
static auto traverse_list(ListNode *head, size_t num_ops) {
  while (num_ops--) head = head->next;
  return head;
}
We just access the nodes sequentially num_ops times. The nodes are located contiguous, and we access them sequentially. Let’s run it!
Intel Kaby Lake Memory Latency Results
Here are somewhat shortened results for my Kaby Lake laptop:
-----------------------------------------------------------
Benchmark                                   Time      Nodes
-----------------------------------------------------------
memory_latency_list/size KB:1            1.01 ns         16
memory_latency_list/size KB:2            1.02 ns         32
memory_latency_list/size KB:4            1.10 ns         64
memory_latency_list/size KB:8            3.32 ns        128
memory_latency_list/size KB:16           3.32 ns        256
memory_latency_list/size KB:32           3.33 ns        512
memory_latency_list/size KB:64           5.33 ns       1024
memory_latency_list/size KB:128          8.58 ns         2k
memory_latency_list/size KB:256          13.9 ns         4k
memory_latency_list/size KB:512          14.2 ns         8k
memory_latency_list/size KB:1024         14.2 ns        16k
memory_latency_list/size KB:2048         17.3 ns        32k
memory_latency_list/size KB:4096         63.1 ns        64k
memory_latency_list/size KB:8192         96.4 ns       128k
memory_latency_list/size KB:16384         104 ns       256k
Let’s add to the picture the cache size and latency from the specs above:
L1 cache hit latency:   5 cycles / 2.5 GHz = 2 ns
L2 cache hit latency:  12 cycles / 2.5 GHz = 4.8 ns
L3 cache hit latency:  42 cycles / 2.5 GHz = 16.8 ns
Memory access latency: L3 cache latency + DRAM latency = ~60-100 ns
And when you put it all on a graph:

The colored vertical bars represent the cache size and latency from the specs. The black-red line is the average access latency from the benchmark.
Note the parts of the graph marked in red. The difference between the CPU specifications and the benchmark results is huge! Hmm…
Benchmarking Intel Haswell Memory Latency
Let’s confirm the results on a different architecture. I have another laptop with older Haswell i5–4278U CPU running at 2.6GHz, so let’s run the same benchmark there. Here are the Haswell specs:
L1 cache hit latency:   5 cycles / 2.6 GHz = 1.92 ns
L2 cache hit latency:  11 cycles / 2.6 GHz = 4.23 ns
L3 cache hit latency:  34 cycles / 2.6 GHz = 13.08 ns
Memory access latency: L3 cache latency + DRAM latency = ~60-100 ns
The raw benchmark results:
-----------------------------------------------------------
Benchmark                                   Time      Nodes
-----------------------------------------------------------
memory_latency_list/size KB:1            1.30 ns         16
memory_latency_list/size KB:2            1.29 ns         32
memory_latency_list/size KB:4            1.30 ns         64
memory_latency_list/size KB:8            3.92 ns        128
memory_latency_list/size KB:16           4.03 ns        256
memory_latency_list/size KB:32           3.90 ns        512
memory_latency_list/size KB:64           6.54 ns       1024
memory_latency_list/size KB:128          9.71 ns         2k
memory_latency_list/size KB:256          17.4 ns         4k
memory_latency_list/size KB:512          21.2 ns         8k
memory_latency_list/size KB:1024         21.2 ns        16k
memory_latency_list/size KB:2048         28.9 ns        32k
memory_latency_list/size KB:3072         43.3 ns        48k
memory_latency_list/size KB:4096         52.0 ns        64k
memory_latency_list/size KB:8192         71.8 ns       128k
memory_latency_list/size KB:16384        80.4 ns       256k
And here is the graph for the Haswell microarchitecture:

Not only it confirms the huge difference between the CPU specs and the results, but L3 latency from the specs not even touching the results graph!
Analyzing Memory Latency Benchmark
It appears, the simple list traversal is a bit more complicated than it seemed. Looking at the Kaby Lake and Haswell latency graphs above, there are a few questions for a deeper analysis:
- Why the latency graph matches CPU specifications only up to 4 KB?
- Why the measured latency is much higher than the CPU specs?
- The list nodes are accessed sequentially, with fixed steps. Despite that simple access pattern, why CPU cache prefetching doesn’t help?
- And the most important: what do we do to lower the access latency?
Intel Kaby Lake Level 1 Cache Latency Analysis
To zoom into L1 cache, let’s run the same benchmark with 1 KB step:
------------------------------------------------------
Benchmark                              Time      Nodes
------------------------------------------------------
memory_latency_list/size KB:1       1.02 ns         16
memory_latency_list/size KB:2       1.03 ns         32
memory_latency_list/size KB:3       1.03 ns         48
memory_latency_list/size KB:4       1.05 ns         64
memory_latency_list/size KB:5       3.33 ns         80
memory_latency_list/size KB:6       3.33 ns         96
memory_latency_list/size KB:7       3.33 ns        112
memory_latency_list/size KB:8       3.35 ns        128
Here is the graph:

The graph is flat and in accordance with the specs up until the “magic” 4 KB point. Then the latency jumps from 1.05 ns to 3.33 ns. It’s three times slower!
Let’s make a break for some bits of knowledge.
Modern CPUs Basics: Virtual and Physical Memory
Modern processors run each process in a virtual address space:

Each process has an illusion of a huge 64-bit contiguous address space available just for its needs, but in fact, each memory allocation maps a piece of physical memory called “page” to process virtual address space. That is convenient and secure (due to process isolation), but now each memory access requires translation from virtual to physical address space.
There is a part of CPUs called the Memory Management Unit (MMU) which translates virtual to physical addresses. MMU uses a cache to translate virtual to physical addresses called Translation Lookaside Buffer (TLB).
What often slips from the attention is that TLB is a hierarchy of caches, not just a plain cache. Here is the Kaby Lake TLB hierarchy specification:
Level 1 Instruction Cache TLB (ITLB) for 4 KB pages: 128 entries
Level 1 Data Cache TLB (DTLB) for 4 KB pages:        64 entries
Level 1 Data Cache TLB (DTLB) for 2/4 MB pages:      32 entries
Level 1 Data Cache TLB (DTLB) for 1 GB pages:        4 entries
Level 2 Unified TLB (STLB) for 4 KB and 2 MB pages:  1536 entries
Level 2 Unified Cache TLB (STLB) for 1 GB pages:     16 entries
For 4 KB pages, there are just 64 level 1 cache entries and up to 1536 level 2 cache entries shared with instructions. That’s not much…
Level 1 Cache Latency Analysis (continued)
Getting back to the level 1 access latency jump. Remember the 4 KB padding between the next pointers, so each node is at least a memory page size. The latency jumps after 64 list nodes, hence after 64 pages:

That’s the exact number of level 1 DTLB cache entries from the specs:
Level 1 Data Cache TLB (DTLB) for 4 KB pages: 64 entries
So, while the data still fits into the L1 cache, virtual to physical address translation does not fit into L1 DTLB. That explains the latency jump.
Intel Kaby Lake Level 2 Cache Latency Analysis
Now let’s zoom into level 2 cache latency:

As we just discovered, because the L1 TLB misses, the latency is much higher than the specs across all level 2 latency graph. The step between 96 KB and 112 KB is not that dramatic as it is in the level 1 graph, but still quite prominent.
Let’s check the number of list nodes again:
--------------------------------------------------------
Benchmark                                Time      Nodes
--------------------------------------------------------
memory_latency_list/size KB:48        4.72 ns        768
memory_latency_list/size KB:64        5.42 ns       1024
memory_latency_list/size KB:80        5.34 ns      1.25k
memory_latency_list/size KB:96        5.80 ns       1.5k
memory_latency_list/size KB:112       7.97 ns      1.75k
memory_latency_list/size KB:128       8.34 ns         2k
memory_latency_list/size KB:144       8.36 ns      2.25k
memory_latency_list/size KB:160       8.82 ns       2.5k
And here are the Kaby Lake specs:
Level 2 Unified TLB (STLB) for 4 KB and 2 MB pages: 1536 entries
Due to the 4 KB padding, each list node is at least a memory page size. So the reason is quite the same: once the number of nodes (i.e. the number of pages) is greater than the number of STLB entries, the latency increases significantly.
Intel Kaby Lake Level 3 Cache Latency Analysis
There are no TLB mysteries left to discover, so what’s going on in the level 3 cache?

Level 3 cache is a point of coherency, so it’s shared across all the cores. Despite the 4 MB size, each core is able to use only up to 2 MB of L3 cache.
The software developer manuals cover this subtle detail. The information is also available on Wikipedia: https://en.wikipedia.org/wiki/Kaby_Lake.
What About The Cache Prefetching?
Some of you might have noticed the trick we played in this benchmark: the page size padding makes the TLB hierarchy more prominent.
Kaby Lake has two hardware prefetchers. The CPU predicts memory locations to be accessed, and fetches the data in advance. All the lists are contiguous, and traversed sequentially, so the access pattern is easily predictable.
With prefetching, the average access latency should be below the specs. But on the graph across all the working sets, the latency is always above the specs.
The answer is in the Intel manuals: data prefetching requires the prefetched cache lines to be in the same 4 KB page. So with a page size padding not only we emphasized the TLB effect but also disabled the cache prefetching.
How to Avoid TLB Misses
In this particular benchmark, the obvious solution would be to use TLB caches more efficiently by simply removing the padding, hence making the list nodes more compact. But it’s not always an option: for large data structures or when the nodes are not contiguous, we are limited to just 64 pages.
All modern CPUs support pages larger than 4 KB. In Linux, those called huge pages, in FreeBSD — super pages, and in Windows those are just large pages.
To avoid TLB misses, the lists must be allocated using huge pages.
Key Takeaways
Memory access in modern CPUs is a huge topic, and we’ve just scratched the surface here. Main takeaways:
- Besides the CPU cache hierarchy, there is also a TLB cache hierarchy.
- There are just 64 L1 cache DTLB entries, so once an app uses more than 64 of 4 KB pages, there are always L1 TLB cache misses.
- The cache prefetching works only within the same 4 KB page.
Full source code: https://github.com/berestovskyy/applied-benchmarks
The graph will be steeper, and the latency much higher than the CPU specifications.
See the link above for more details.