How To use the Digital Experience Score to Gain Insights into DEX of the organization using Nexthink
Understanding the impact of digital employee experience allows IT leaders to get a sense of the maturity of their organization, set goals and drive improvements based not on trial and error, but on clear evidence derived from organizational data.
Let us now gain insights into DEX of the organization using Nexthink Experience Central.
By using hard data retrieved from endpoints, the DEX score provides a simple, yet actionable way to monitor the real experience of employees in their digital workplace and identifies opportunities for improvements. The goal is to increase productivity, reduce costs, reduce
attrition and reduce time to market.
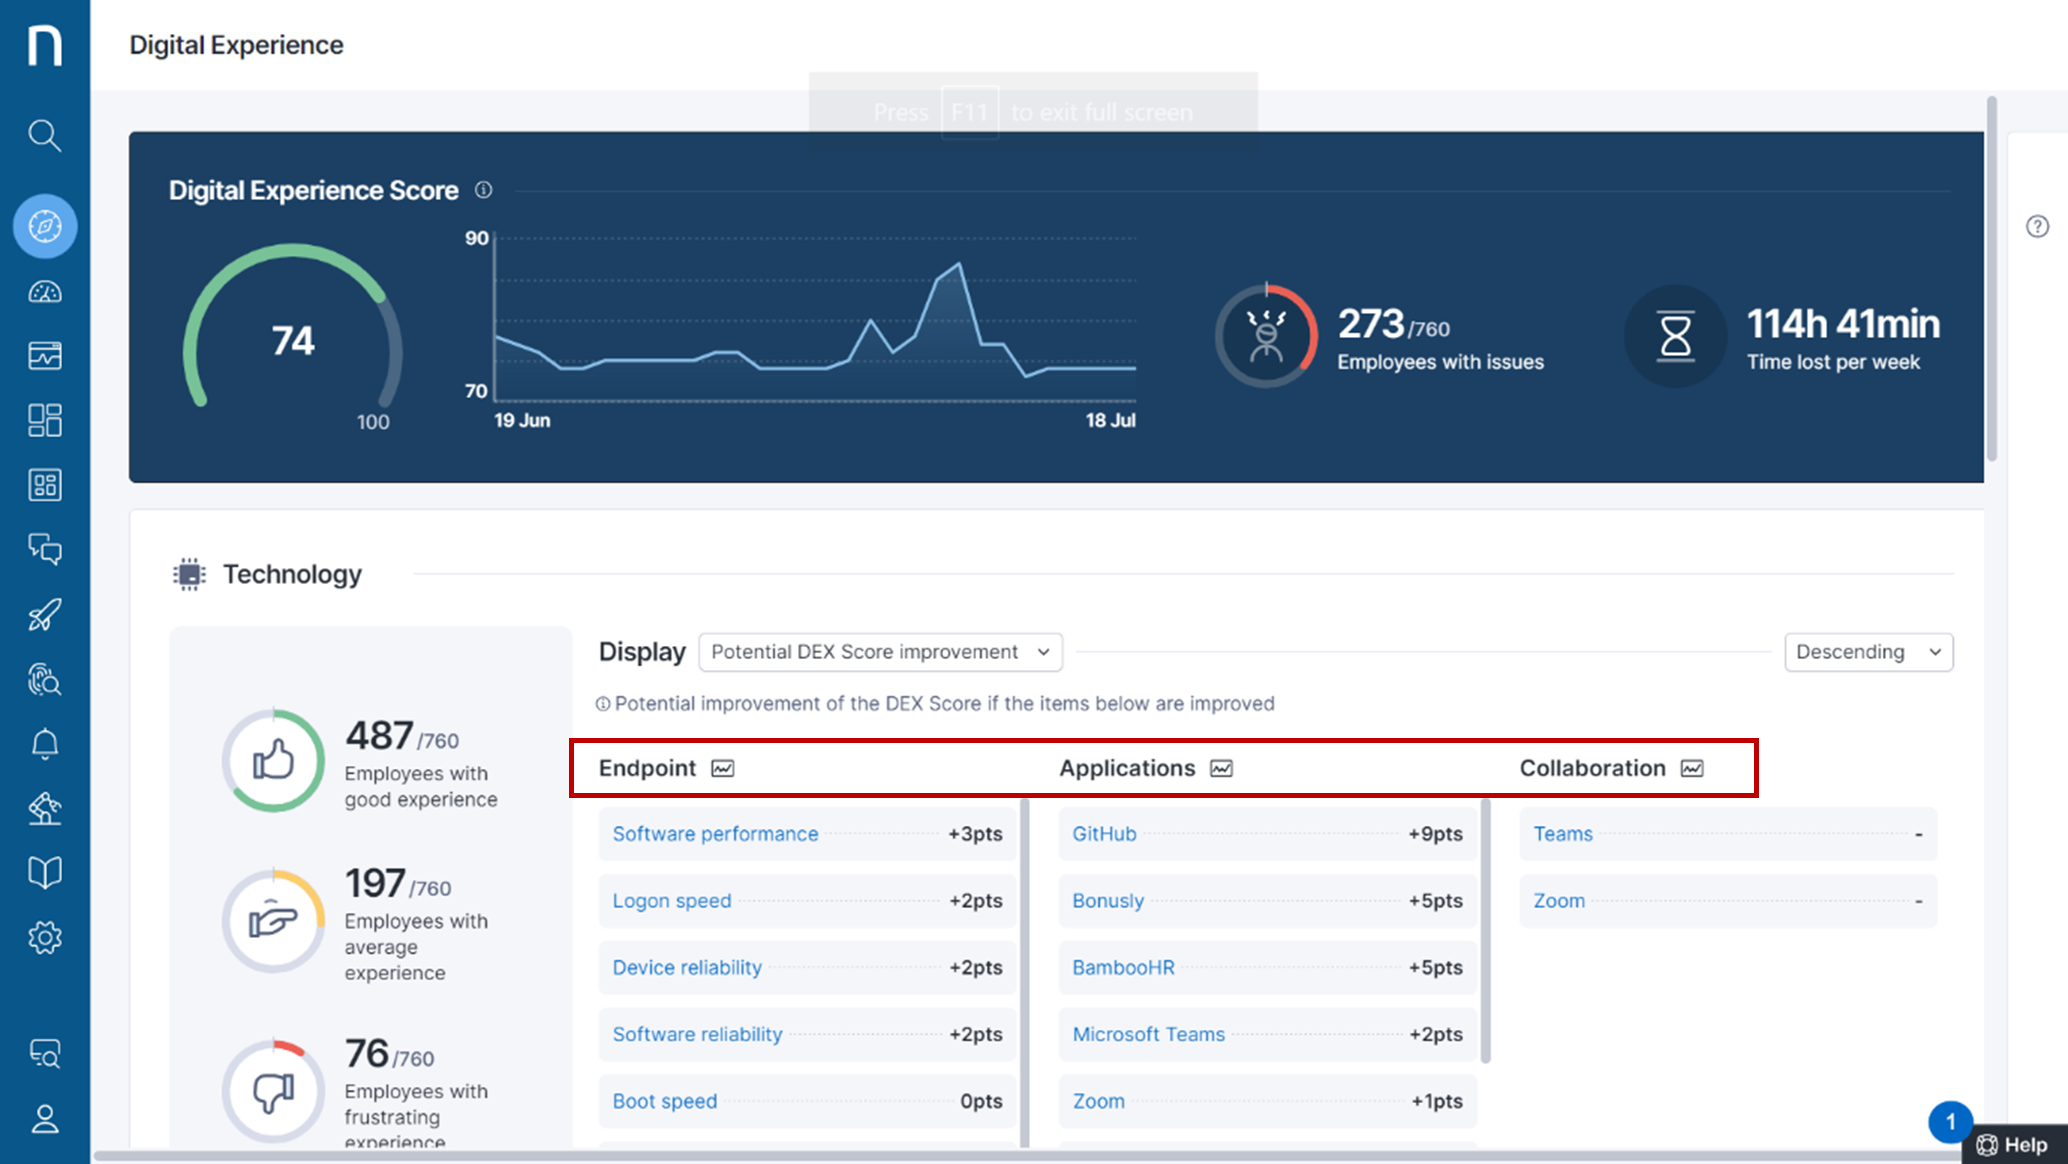
The DEX score assesses three areas that impact DEX they are :
- Endpoint
- Applications
- Collaboration

The Nexthink Experience central Dashboard is a key indicator that enables you to:
- Understand how, when and why they need to improve DEX using factual data.
- Listen to the voices of employees while monitoring hard metrics.
- Benchmark with outside organizations or internally, for example by using one region against another.
DEX refers to an employee’s ability to get things done by interacting with the IT environment in an enjoyable and effective manner. It is the cumulation of events and touchpoints with IT that impacts an employee’s perception of it.
Digital Experience Score
Nexthink strives to provide the most meaningful data and reporting capabilities by allowing you to configure the DEX score and tailor it to your environment. The Digital Experience Score (DEX)score is directly connected with the Digital Experience module.
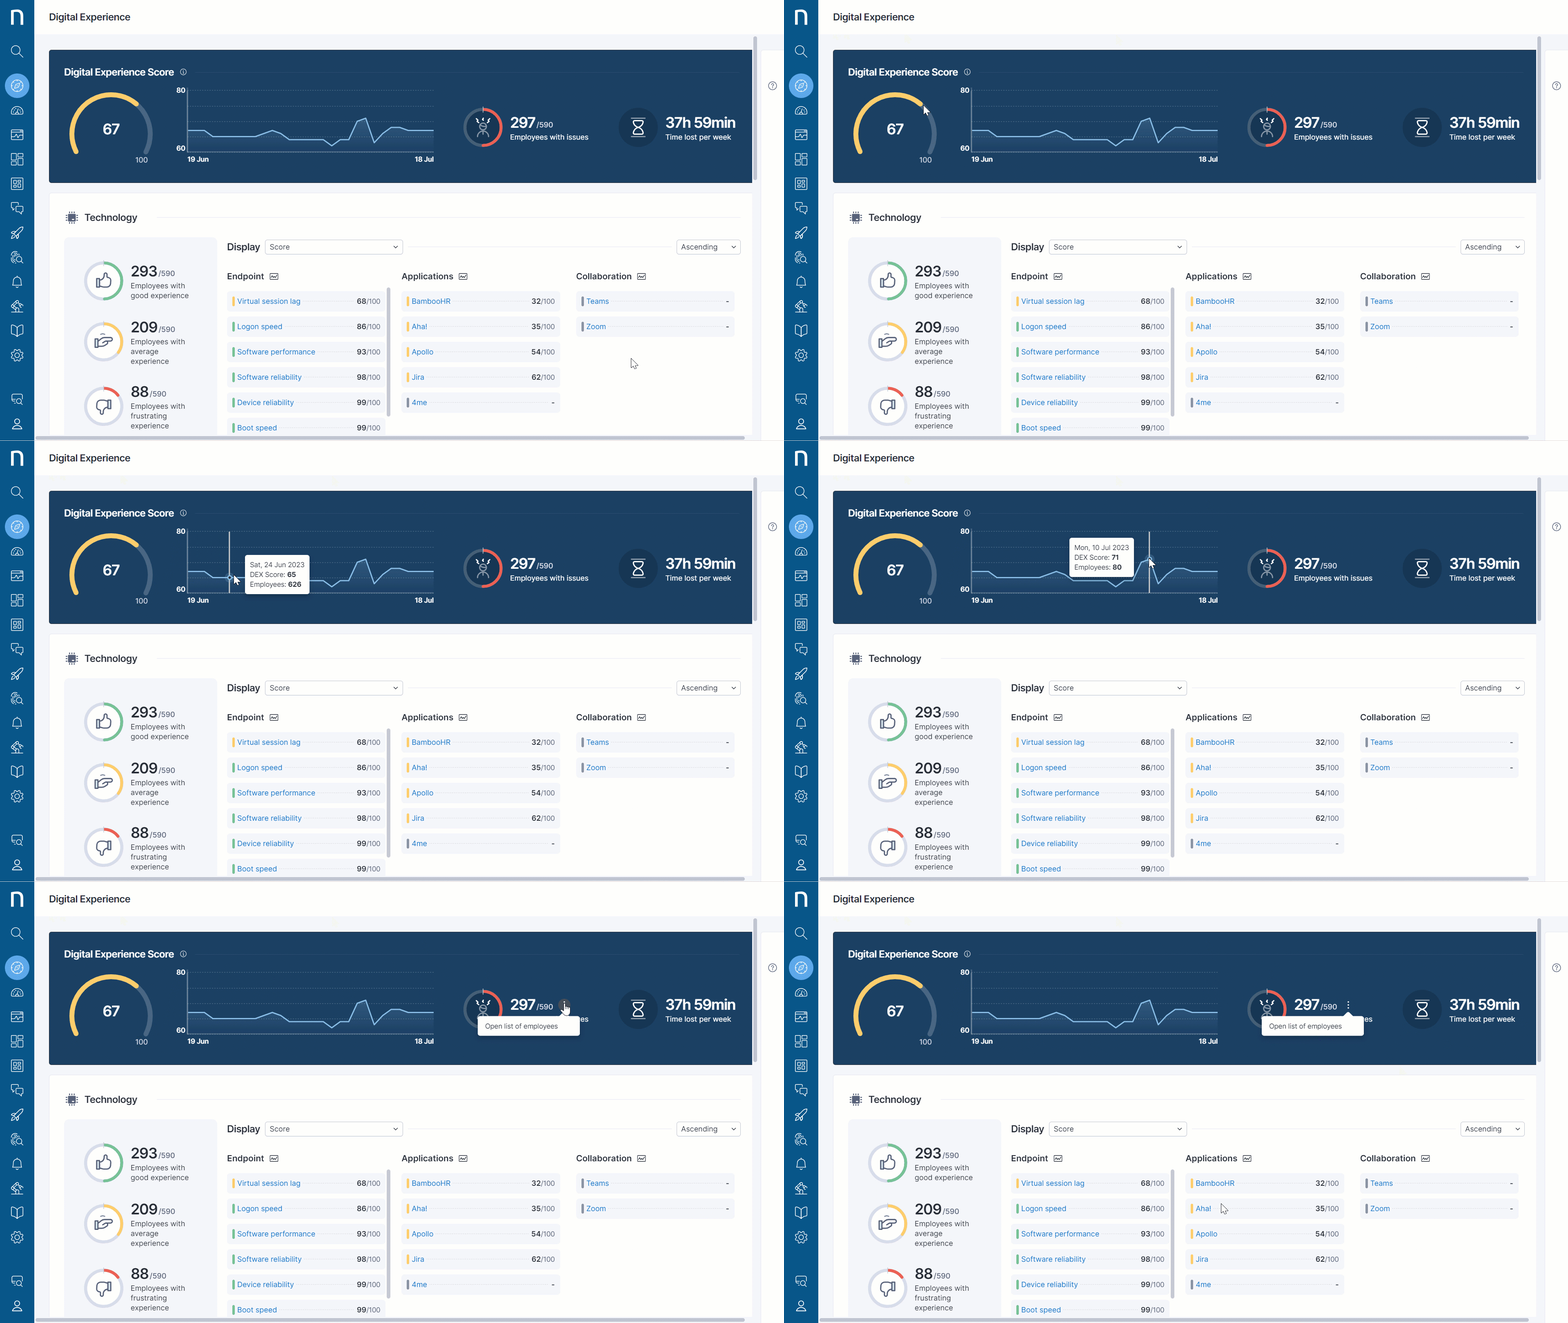
The Digital Experience Dashboard displays the DEX score value which ranges from 0 to 100 for the current day. The line computation shows the evolution of the overall DEX score for the last 30 days. When we hover over the Employees with issues, it enables the action menu. Here, you can select Open list of employees to view the employee list on the Investigations tab.
You can also check for the Time lost per week,this is done using a Duration-based metrics such as login time, page load time and other specified parameters.

Refer to the Digital Experience Score documentation for more information.
Technology
Gauge widget
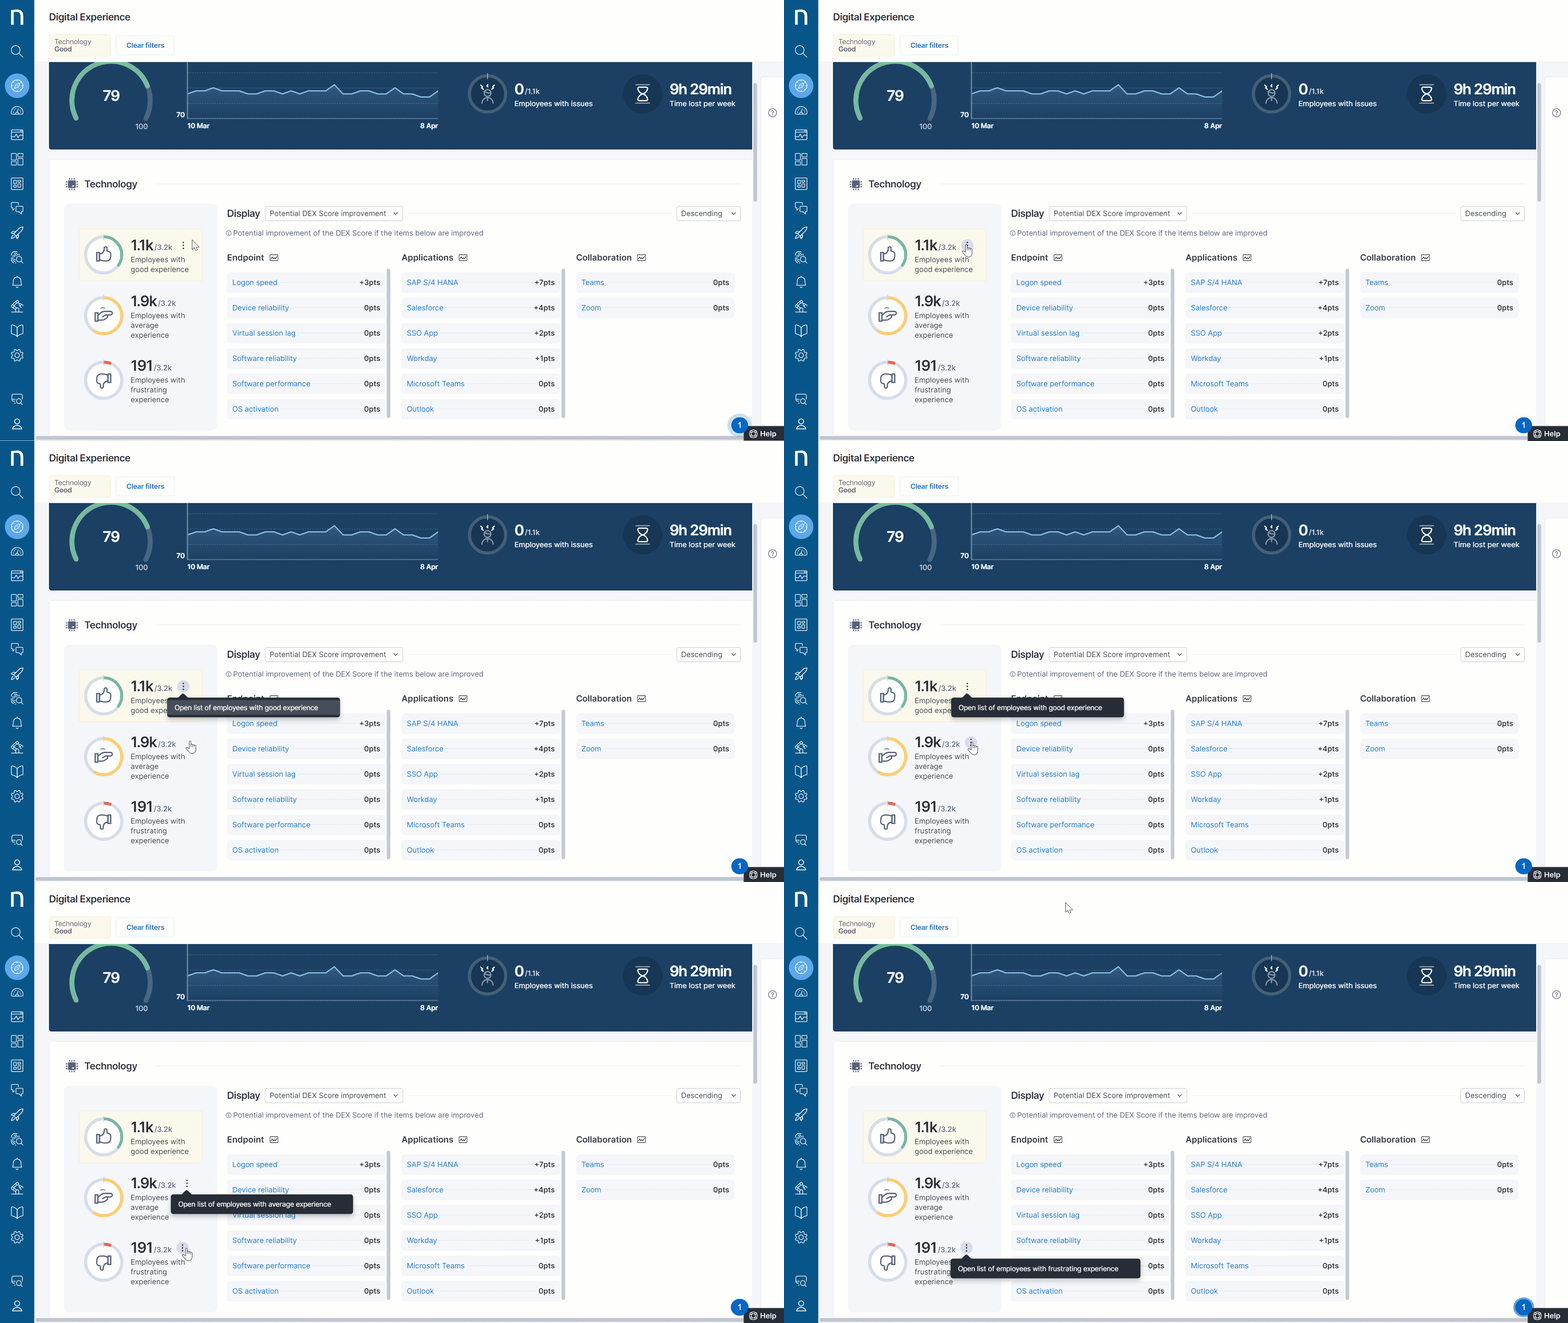
Gauge widgets group users according to the value of their Technology score. The following are the default thresholds:
- Good experience: A score between 71 and 100 appears in green.
- Average experience: A score between 31 and 70 appears in yellow.
- Frustrating experience: A score below 30 appears in red.
You can hover over each of these technology scores to enable the action menu and click on open the list of employees for a detailed drill down on the investigations tab.

Metrics widget
This section provides details and drill down for the key nodes of the Technology score. This is categorized using the three areas that impact DEX Endpoint, Applications and Collaborations
Refer to the Computation of the DEX score (this is a restricted website) documentation for more information about the different types of nodes and how the system composes the DEX score.
Sorting nodes by priority
The system organizes the nodes by priority. Use the Display drop-down menu to sort by:
- Potential DEX score improvement: The average potential improvement on the DEX score if you set the node score to 100 for the selected employees, sorted from highest to lowest.
- Employees with issues: The number of employees that have a frustrating or average experience based on the node score value, sorted from highest to lowest.
- Score: The average node score value for the selected employees, sorted from lowest to highest
- Time lost per week: The overall time lost due to the node for the selected employees, sorted from highest to lowest.
Drill down on each node
Hover over a node to view a tooltip displaying a line chart, Potential DEX score improvement, Employees with issues, Score and Time lost per week.
The link at the top right corner of the pop-up can be accessed for troubleshooting the issue. You can click the link at the bottom of the pop-up, when available, to open an Investigations module with a pre-written NQL statement for more information about the data behind the
computation of the score.
Alternately, clicking directly on a node activates the same link as in the popup and redirects you to the Nexthink web interface.

Sentiment
Digital Experience displays sentiment data from a selected DEX score campaign. Refer to the Manage Digital Experience documentation for more information on how to configure this feature.
Gauge widget
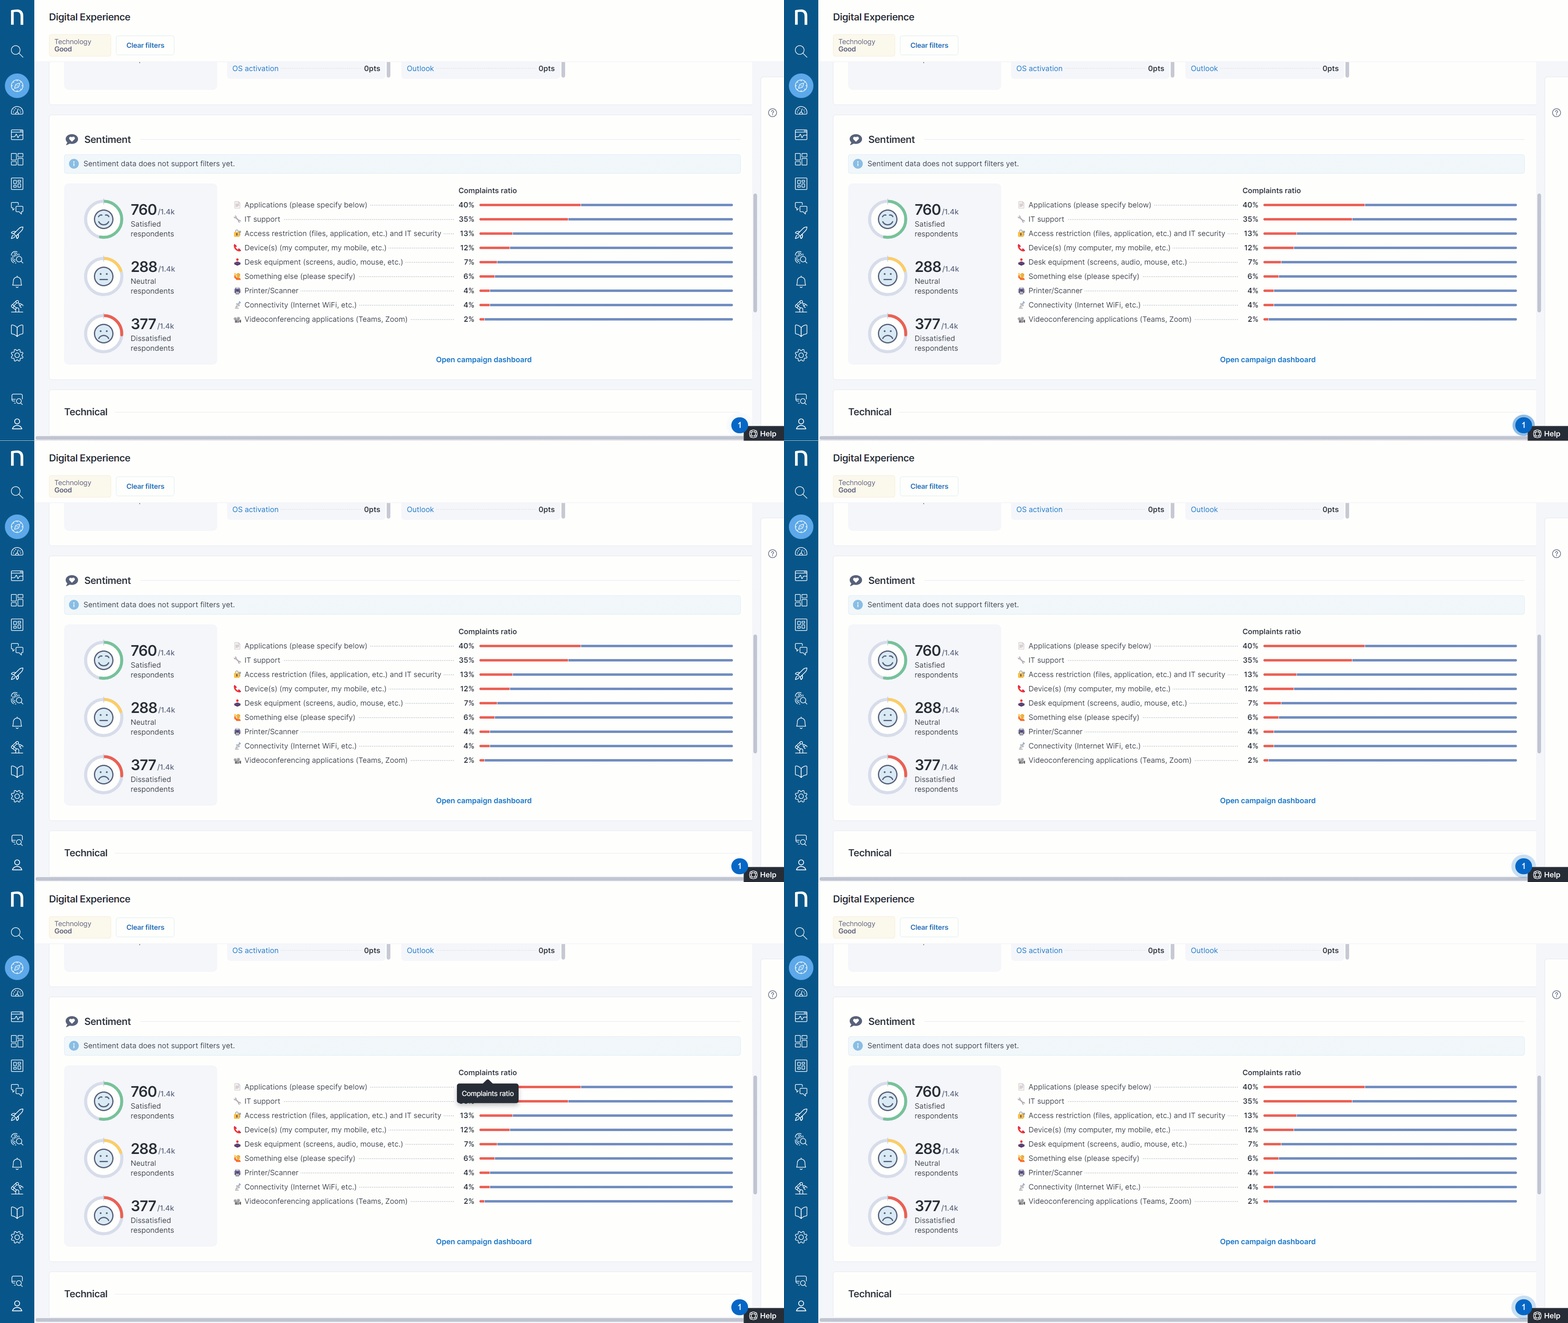
The widget groups users according to their campaign answers and based on their satisfaction with IT:
- Satisfied: Employees that have replied with Very satisfied or Somewhat satisfied
- Neutral: Employees that have replied with Neither satisfied nor dissatisfied
- Dissatisfied: Employees that have replied with Very dissatisfied or Somewhat dissatisfied
Note : The filters applied on the Digital Experience page do not affect the gauge widget.
Complaints
The system displays a list of topics of Dissatisfied respondents with the corresponding percentage of employees that had concerns and raised complaints.
