How to Track Adoption of SaaS Applications Using Nexthink
Digital transformation is complex, and software license costs can balloon your IT budget. Nexthink helps your team track adoption of SaaS applications, so you can make data-driven decisions to lower costs or speed digital transformation.
In this blog, you’ll learn how Nexthink helps IT teams like yours evaluate application adoption and increase usage.
Check out how we track adoption of SaaS Applications using Nexthink in action.
Applications Module
The Applications Module gives you the end-to-end visibility you need across all dimensions of your critical business applications. You can accelerate application adoption & usage and manage the entire application lifecycle from a single view.
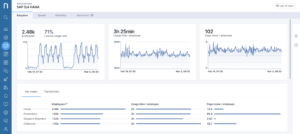
This module continuously gathers usage data from end-users and combines the data into an easy-to-use dashboard that lets you actively monitor the progress of every application rollout. The module also keeps the application owner team informed of any changes that are required – so your team can take action quickly, before small obstacles become major roadblocks.
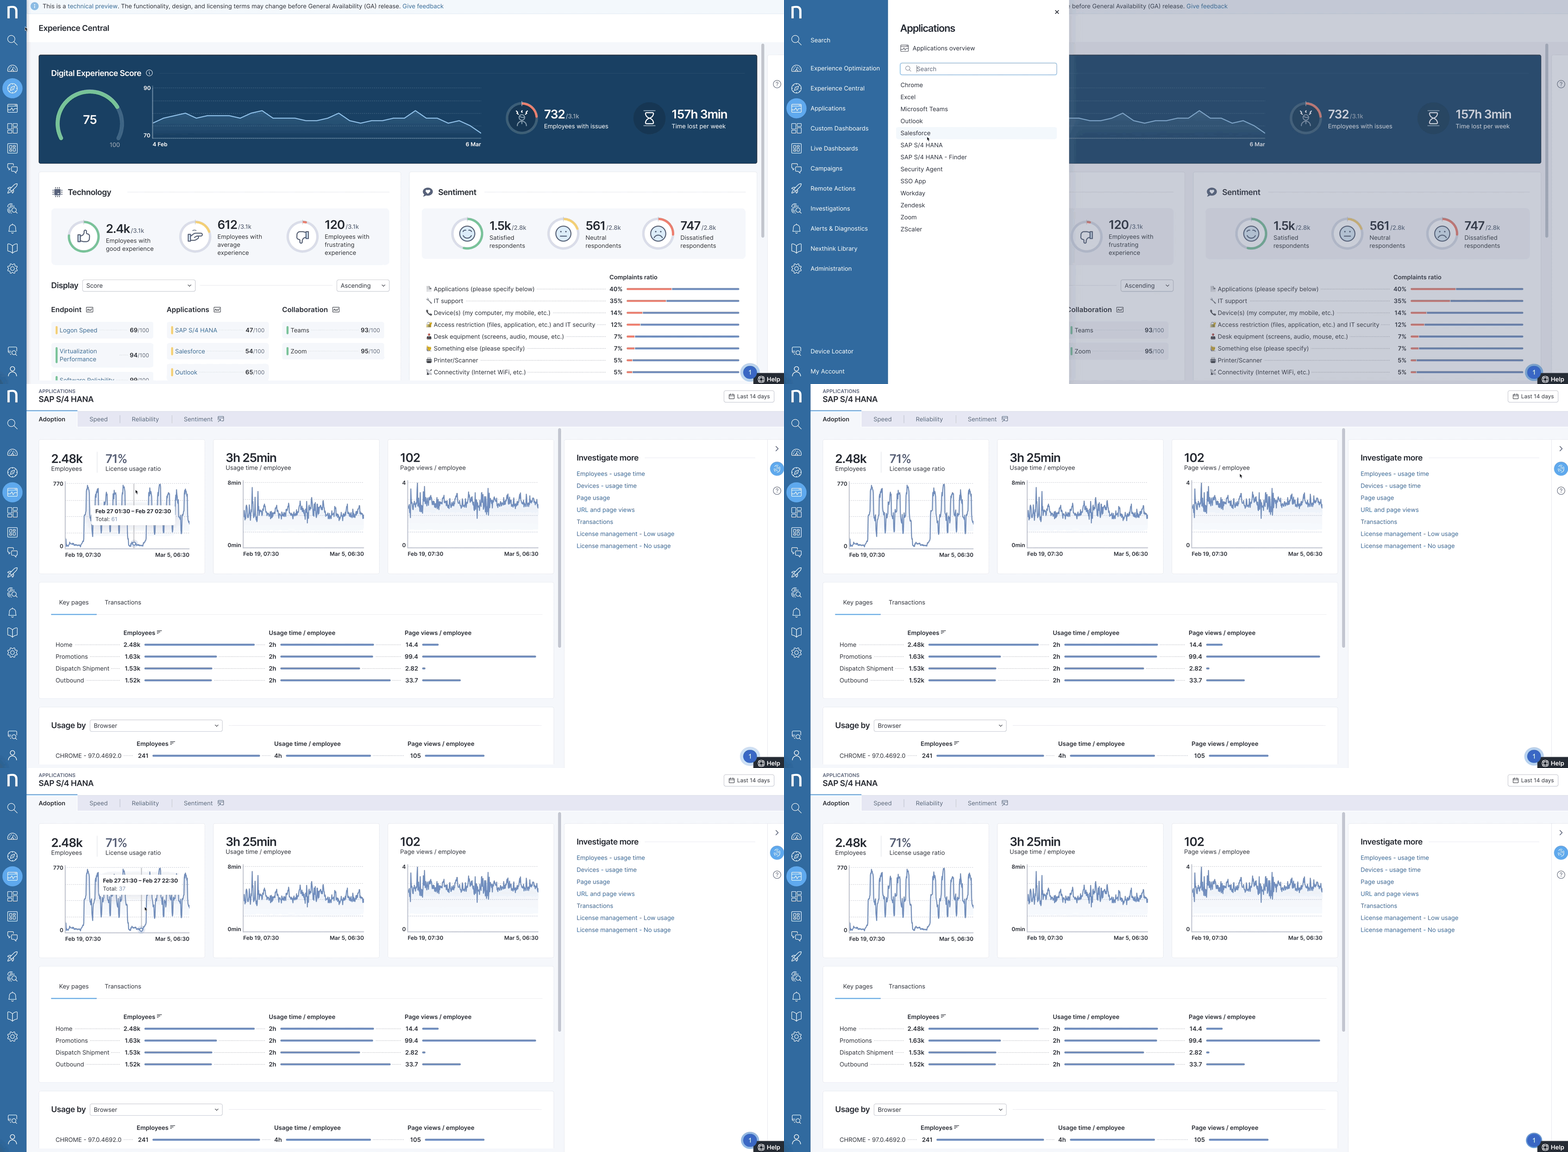
Measuring Adoption Progression
To check the progress of a roll-out on a daily basis, you can use the application dashboard.
After opening the dashboard, you can see the Employee Adoption graph in the top left. Besides that, you can see the usage time and page views by employees. By hovering over the Employees graph, we can see the number of active users on a specific day. This is useful when analyzing any trends for specific weekdays or when identifying days that vary from the average.
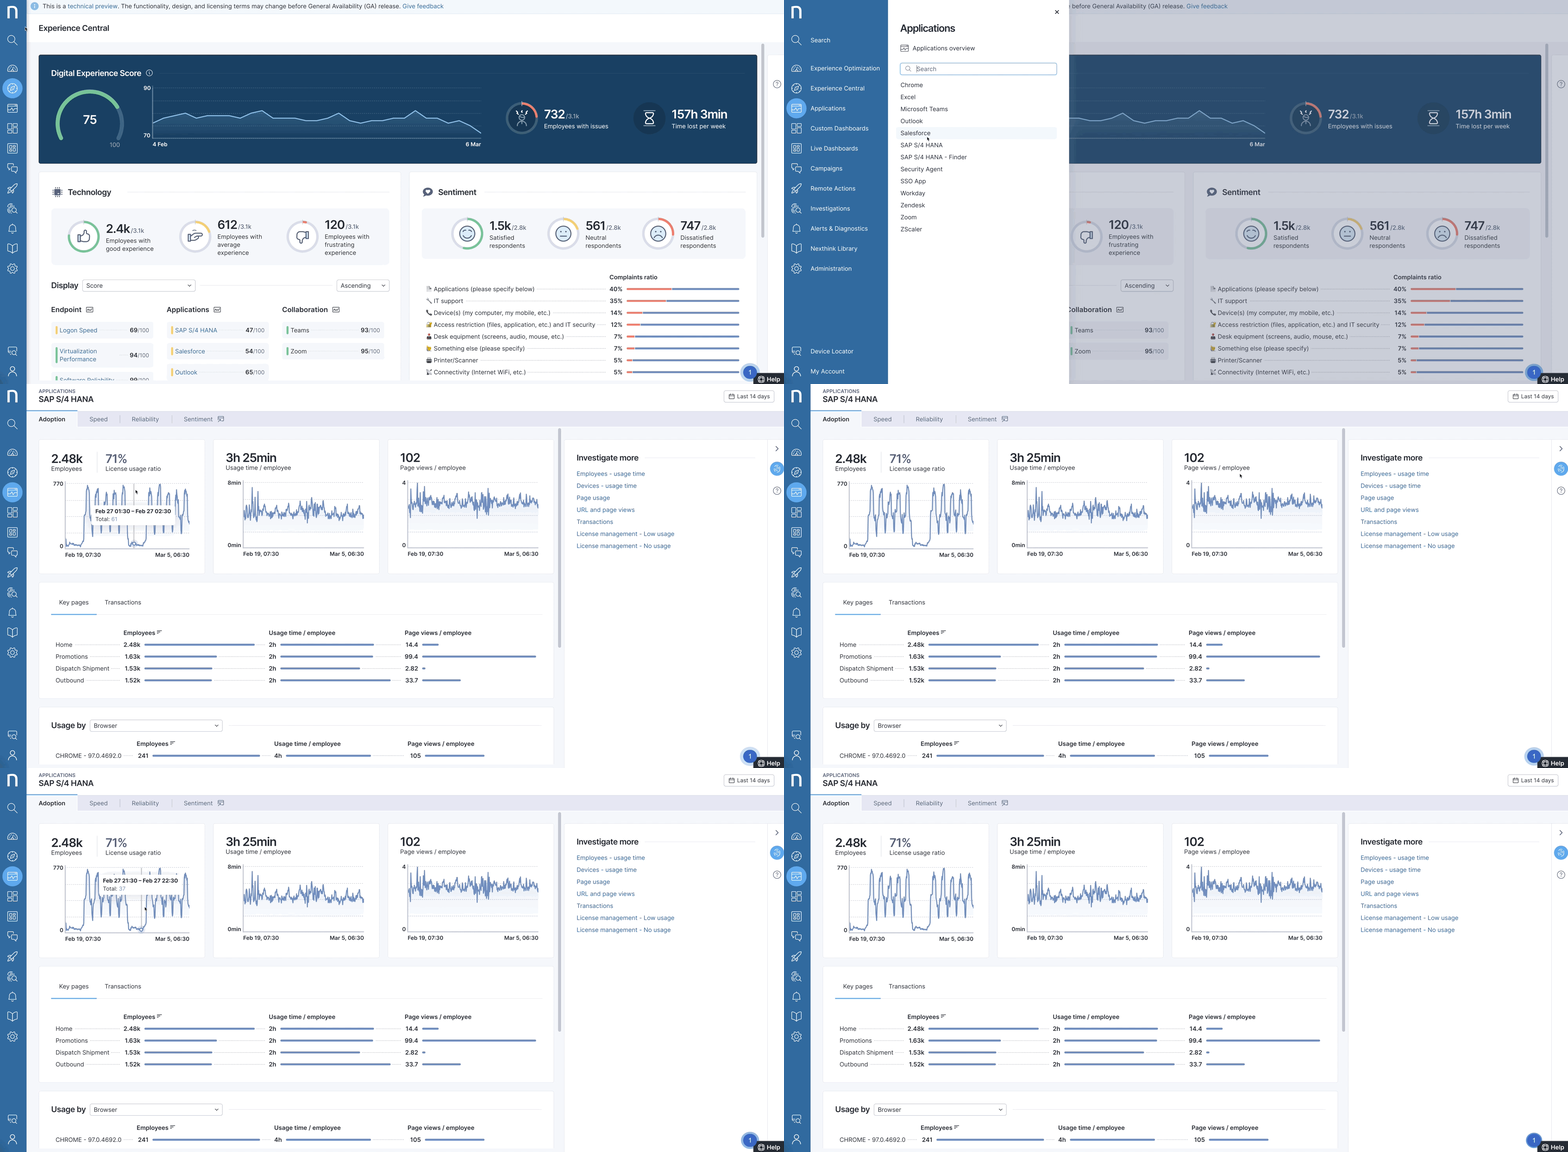
Based on this graph, you can see the progression of the roll-out. You can also double-check and make sure that the assessment is correct by taking a look at the application usage time per employee.
Identifying frequent users of an application
Frequent users of the application can be a valuable source of information when measuring application adoption.
Using this same Application module, you can drill down into employee usage time to find a list of all the users of a specific application and the amount of time those users spend in the application.
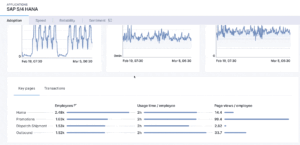
Users with the highest usage time are at the top of the list. You can use this information to reach out to frequent users and understand how they utilize the application as compared to their colleagues. This might help identify challenges or roadblocks to the roll-out.
Analyzing application usage data
After identifying frequent users, you may want to understand which application features are the most and least used. This way, you can use the data to have a discussion with the stakeholders about what actions may need to be taken to improve those numbers.
Just below the Employee Adoption graph, you can find Key Pages and Transactions sections.
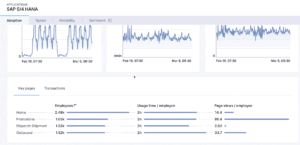
Key Pages shows the number of employees that used a page, how much time they spent using it and how often they visited that page in the timeframe defined in the dashboard.
The Transaction section allows you to track important changes of state within an application that do not necessarily require a complete reload of the page.
Analyzing adoption data on global and regional level
To analyze the adoption of the application on a global level and regional level, the Usage By section at the bottom of the dashboard offers a drop down list of different segmentation options, including country, city, or other data dimensions like browser or operating system.
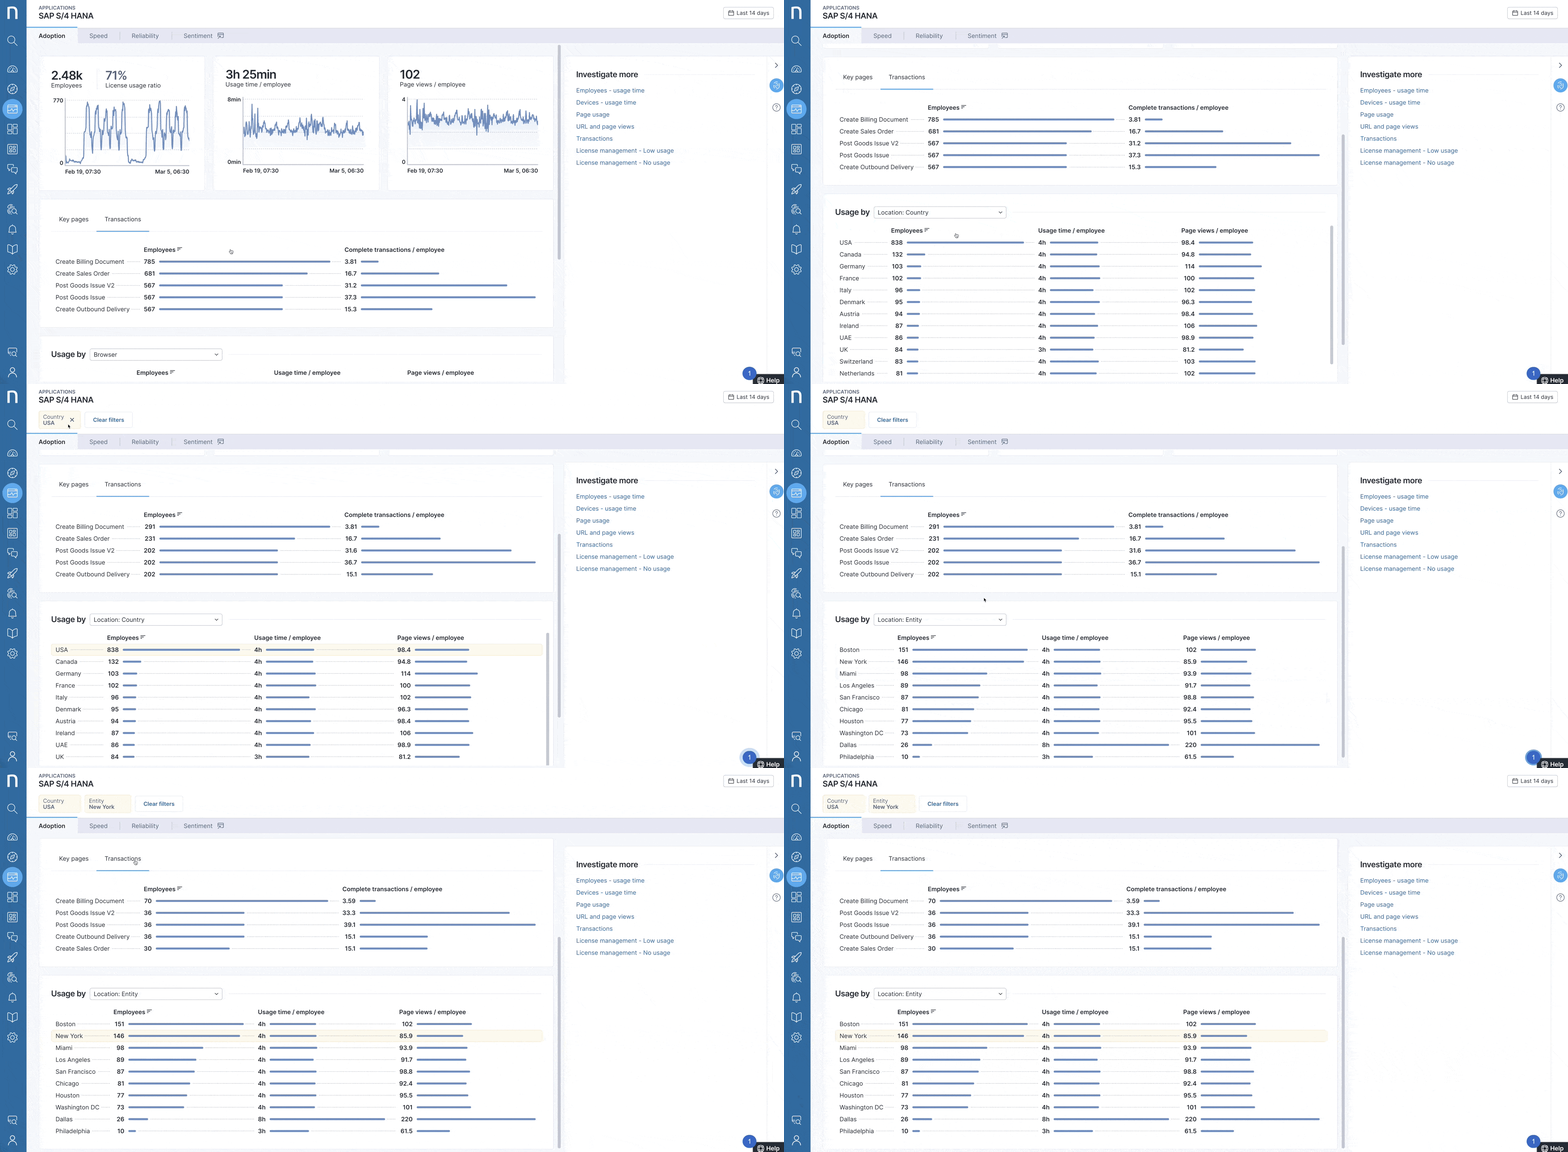
After applying each filter, you’ll see the same three widgets: the number of employees, usage time per employee and page views per employee.
Make Data-Driven Decisions That Don’t Escalate Costs
The Application module allows your team to measure SaaS Application adoption and get critical insights on:
- Measure the progression of an application roll-out.
- Identify frequent users of an application.
- Measure end-user adoption on global and regional levels.
- Identify popular pages and transactions – to focus continuous improvement on the critical areas of application usage
Allowing you to proactively monitor and manage the success of your digital transformation projects and execute intelligent software license reclamation so that the right users have the right applications at the right time.
This is how Nexthink helps IT teams to Track Adoption of SaaS application and increase usage.
Ready to learn how Nexthink could help your team find and fix issues faster? Request a demo today
Related posts:
- Uncover How Your Employees Experience Their SaaS Applications in Real-Time
- Your MS Teams Rollout Needs Specific Help—Not General Guidance
- What Your IT Chatbot Can Look Like Running on Full Power
- 8 Websites Every End-User Computing Professional Needs to be Visiting Daily