The lack of proper insights can make diagnosing incidents difficult. Another factor that can contribute to this is agents having to switch between various tools to remediate user issues. The delay in ticket resolution and escalations drives up AHT and MTTR causing the service desks to struggle.
Watch how Nexthink helps to See, Diagnose, Fix: Issues Faster, Prevent Ticket Overload and Drive Down MTTR and AHT
Nexthink Amplify gives the agents a single view of incidents, diagnostic checklists and remediations, without end user involvement. Nexthink Amplify is an integration between Nexthink and any ITSM solution giving information on impacted devices or users to the Service Desk agents, in order to reduce the mean time to repair (MTTR) and average call handle time (AHT).
Let us see How to reduce MTTR using Nexthink Amplify. Here, we are using Service Now as the ITSM platform.
Step 1: Launch Nexthink Amplify from an incident ticket in the ITSM Solution.
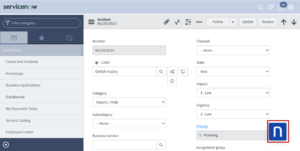
Step 2: Nexthink Amplify provides access to the Properties of the device, Checklists and Remote actions.
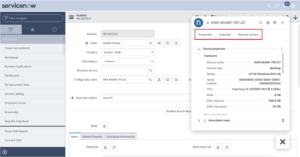
Step 3: Click on the Checklists tab and select the L1 checklist to view all the factors that can impact the performance of the device in one single pane.

Here, you can see that the user has limited diskspace and is experiencing high average CPU usage in the last 24h.
Step 4: Click on the Remote actions tab, you can remediate issues like Diskspace handled by L1 remotely using the Disk Clean-up remote action.
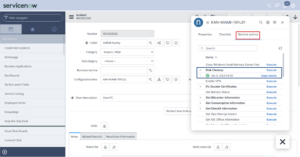
Note : For issues which are not handled by L1, L1 team can now transfer the incident to the right team, reducing loss of time due to ping-pong of incidents but can also transfer the appropriate context for faster resolution.
The corresponding steps are usually performed by the L2 or L3 teams.
Step 5: Click on the Device View icon to gain additional insights into the high CPU utilization issue from Amplify. This opens the device view of the exact same device within Nexthink.
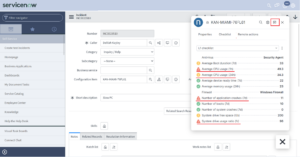
Step 6: Scroll down to the Device performance section of the device view and click on the timeline where the CPU usage is high.
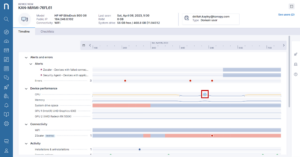
Step 7: Here, you can see the drill down on the right-hand panel, Zoom shows the highest CPU usage.
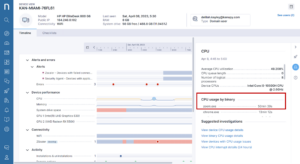
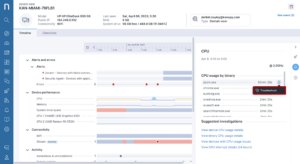
Step 8: Click on vertical ellipsis icon and select Troubleshoot to navigate to the diagnostics page and identify the other impacted devices.
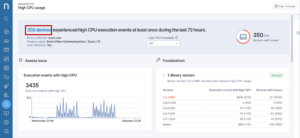
Step 9: You can see that 350 devices shows Zoon high CPU usage. Click on the expand button of the Binary version, the highlight shows the issue is observed with only one specific version of Zoom.
You will note that the devices on the latest version of Zoom has not been impacted.
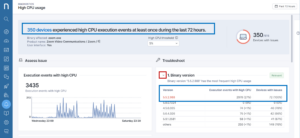
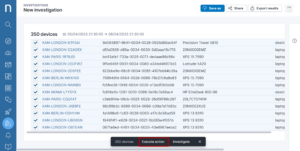
Step 10: Click on the 350 devices, this opens an investigation that lists all the impacted devices.
Step 11: Select all the impacted devices and click on Execute action.
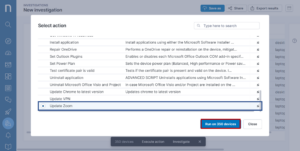
Step 12: Select the remote action Update Zoom to update the Zoom version on all the impacted devices and remediate the issue on all 350 devices.
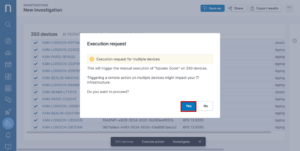
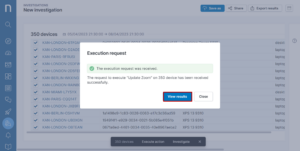
Step 13: Click on Yes to execute the remote action on multiple devices and View Results.
With Nexthink Amplify we can See, Diagnose and Fix the issue proactively but also reduce MTTR.
Ready to learn how Nexthink could help your team find and fix issues faster? Request a demo today.
Related posts:
- How To Improve Poor Call Quality on MS Teams Across the Enterprise with Nexthink
- How To Improve the Performance of SaaS Applications using Nexthink
- 5 Ways Nexthink Amplify Strengthens Your Service Desk
- How Nexthink Provides Complete Visibility into Your Digital Workplace