Application Experience – Next Level Application Management
It is summer in the northern hemisphere and Nexthink has turned up the heat on all things Application Experience. This summer we have released a series of significant enhancements to Application Experience, making it the go-to choice of every IT team that wants to proactively manage and optimize their employees' experience using any application. From Binaries, through hybrid apps, and every type of web application (custom, customizable/extensible SaaS, and packaged commercial SaaS), Application Experience is your single stop for comprehensive management and optimization of every application and every experience.
1. Simplified Licensing for All Applications
Recognizing that many customers would like to manage more than 100 web applications, and in conjunction with our recent introduction of Network Applications, we have simplified the
licensing rules to give customers the utmost flexibility in matching their needs.
- The base Nexthink Workplace Experience license now includes up to 200 Desktop (aka: Binaries) and Network Applications to be configured; in any combination desired by our customers. It does not have to be 100/100, but could be 150/50, or any other mix totaling up to 200.
- Base Nexthink Workplace Experience license continues to allow customers to configure and use up to 3 web applications.
- The Application Experience licenses grants customers the ability to configure up to 100 web applications, and, for those desiring more offers the ability to license additional packs of 100 web apps when their usage expands.
2. Extending Web Application Performance Analysis and Diagnostics
Recognizing that EUC and Application teams need ever more comprehensive insights into the performance of web applications to efficiently escalate application problems to application
teams or 3rd part vendors, we have extended telemetry and analysis further inside individual web pages.
This extension delivers 12 new "Waterfall Metrics” for all page views. This view into the individual web resources that are sequentially loaded to deliver a total page load experience massively extends diagnostics, delivering truly actionable insights.
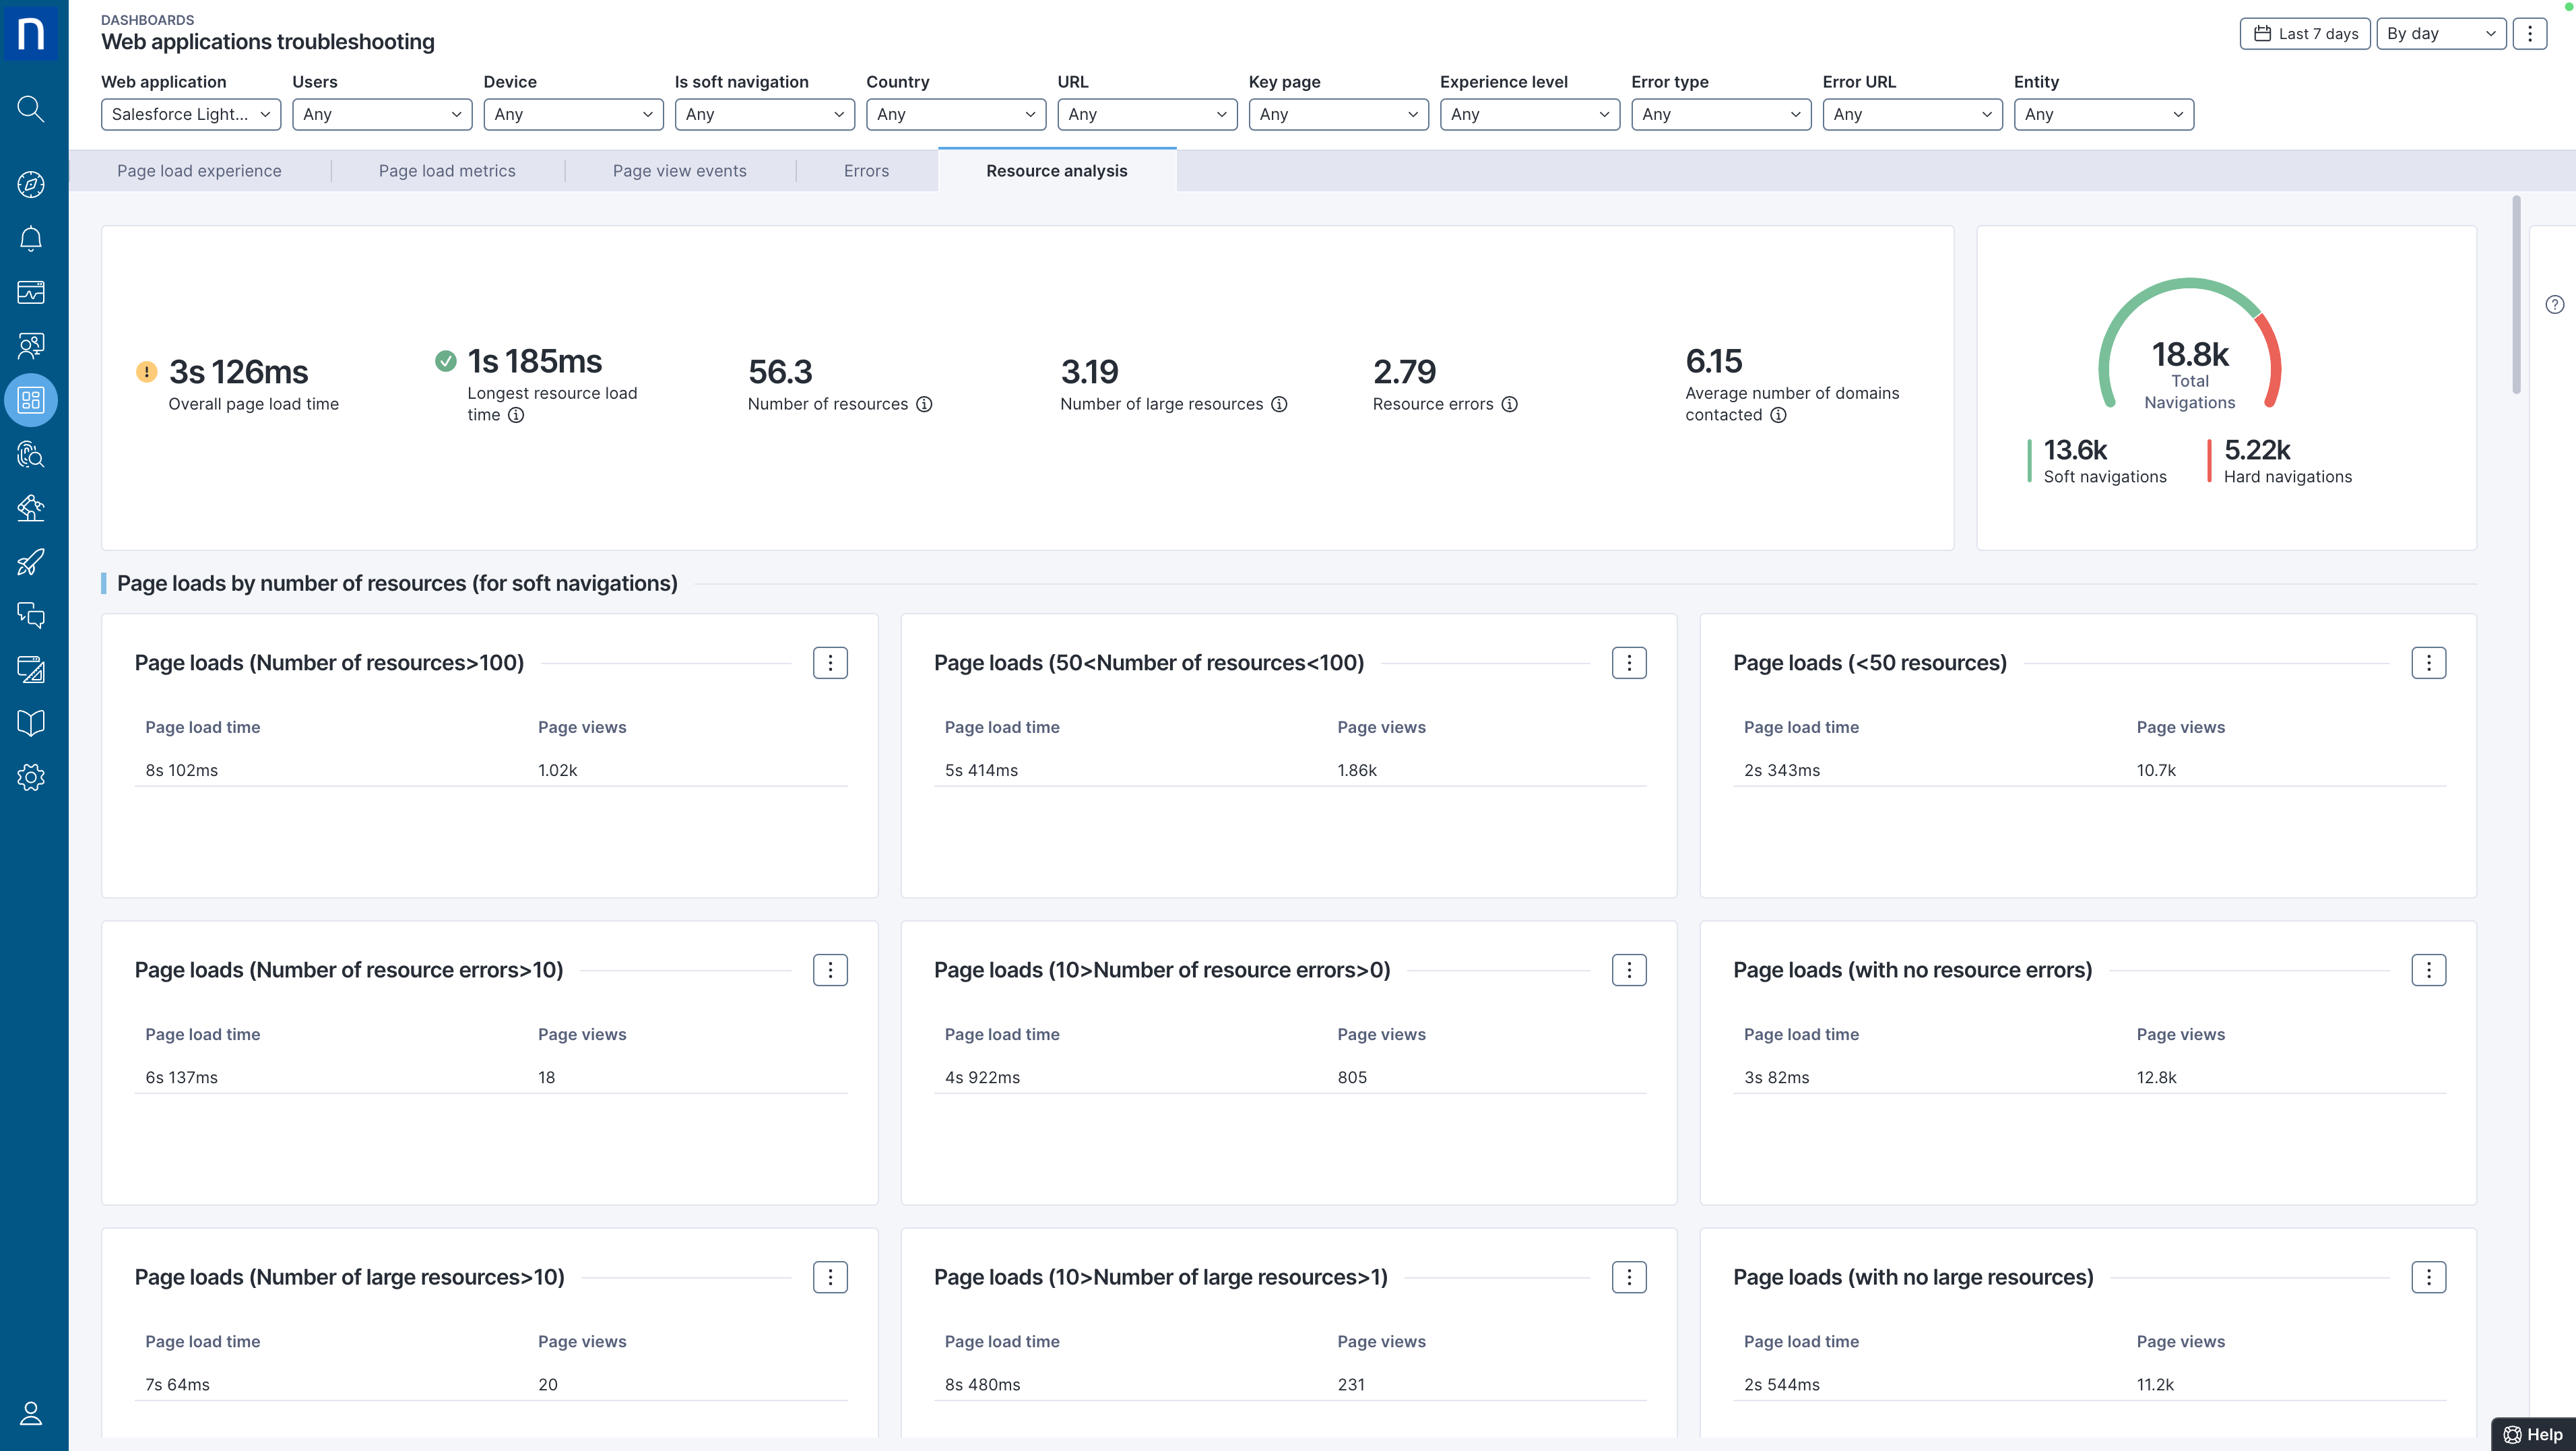
There are 12 new metrics across several categories:
- Resources that take the longest time. Because performance as experienced by
employees is all about time, we now deliver a set of 4 critical metrics to fully inform this angle of diagnostic troubleshooting and remediation. These are: the specific name of the resource, what type of resource it is, the size of the resource, and the duration it takes to load. - Resources that are the Largest. Typically, the largest resources are the most consumptive of IT resources, driving high likelihoods that they are on “the critical path” of experienced performance. The 4 new metrics in this category are: the specific name of the resource, what type it is, how large it is, and how long it takes to load.
- Domains Contacted. Modern web applications (whether custom or packaged, commercial SaaS) typically have multiple web domains linked underneath any given page load. When there are delays in “hopping” across these web domains, it negatively impacts experienced performance. And this stacked and networked set of interdependencies creates significant challenges in understanding exactly where slowdowns are occurring.
- Number of Resource Errors – the number of resource errors, to scope the magnitude of the issues and focus on areas with the highest impact.
- Number of Resources – the number of resources indicates the total number of all resources required for a complete page load. Typically, the more individual resources, the slower the page loads will be. This information can guide investigations into the potential gains associated with combining script files, compressing images, etc.
- Number of Large Resources – how many resources over 100KB are required as part of a complete page load. This information further guides and informs paths for page speed optimization.
"APM? We don't need no stinking APM!"
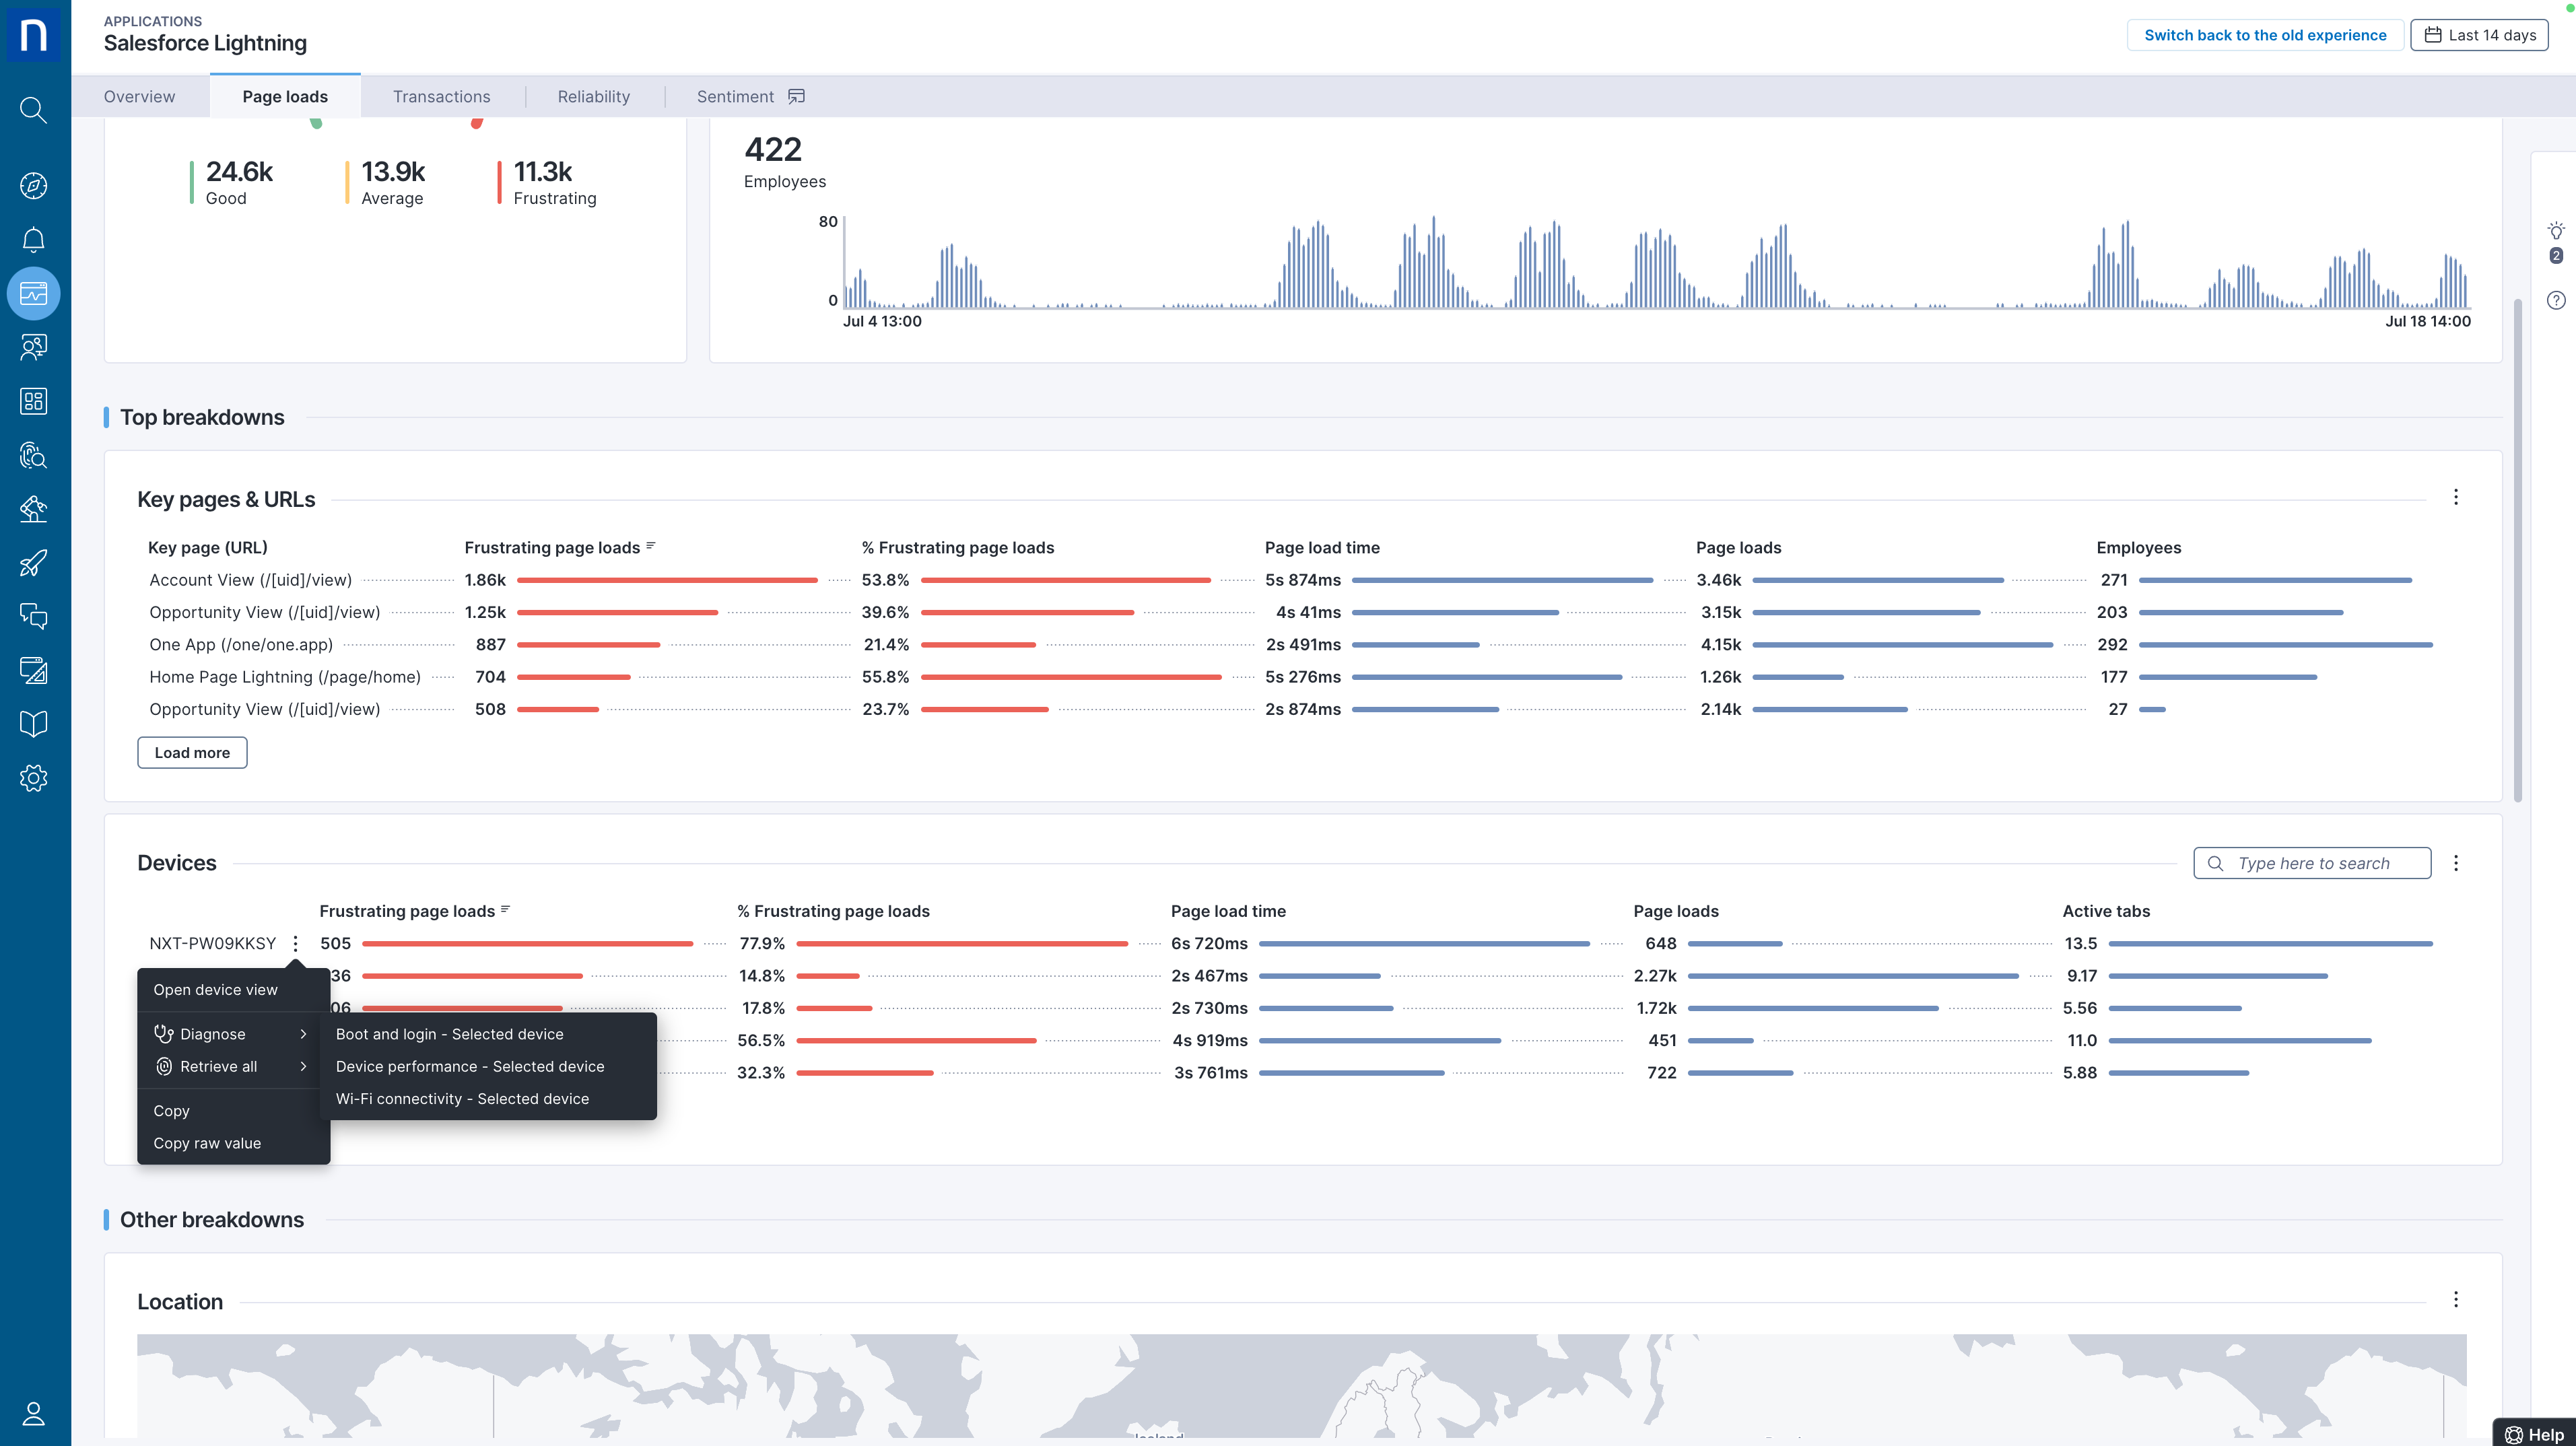
Together, these comprehensive “deep dive” metrics give IT teams detailed diagnostic and analytic capabilities formerly reserved for expensive, bespoke Application Performance Management (APM) tools, without their cost and complexity. And Application Experience provides fully enriched total context including related device performance metrics that are simply unavailable in any APM solution:
Even better, because the Nexthink Application Experience browser extension does not require modifying the application itself, it can be applied to ANY web application, giving IT teams a truly “one stop shop” for diagnosing any web application – whether custom or commercial/packaged.
3. All New Application Experience Dashboards - Speeding Time To Value (Tech. Preview)
As Application Experience capabilities have and continue to rapidly expand, the technical complexity behind rapidly identifying key issues of importance has grown. Using comprehensive user research with our existing Application Experience Customers we determined that the current 5-tab structure was limiting many customers' successful adoption of all Application Experience capabilities.
To fulfill the goal of presenting application experience (performance, reliability) and adoption data to application teams in a way that is usable without deep web development expertise, we have implemented an all-new set of Application Experience dashboards, as follows:
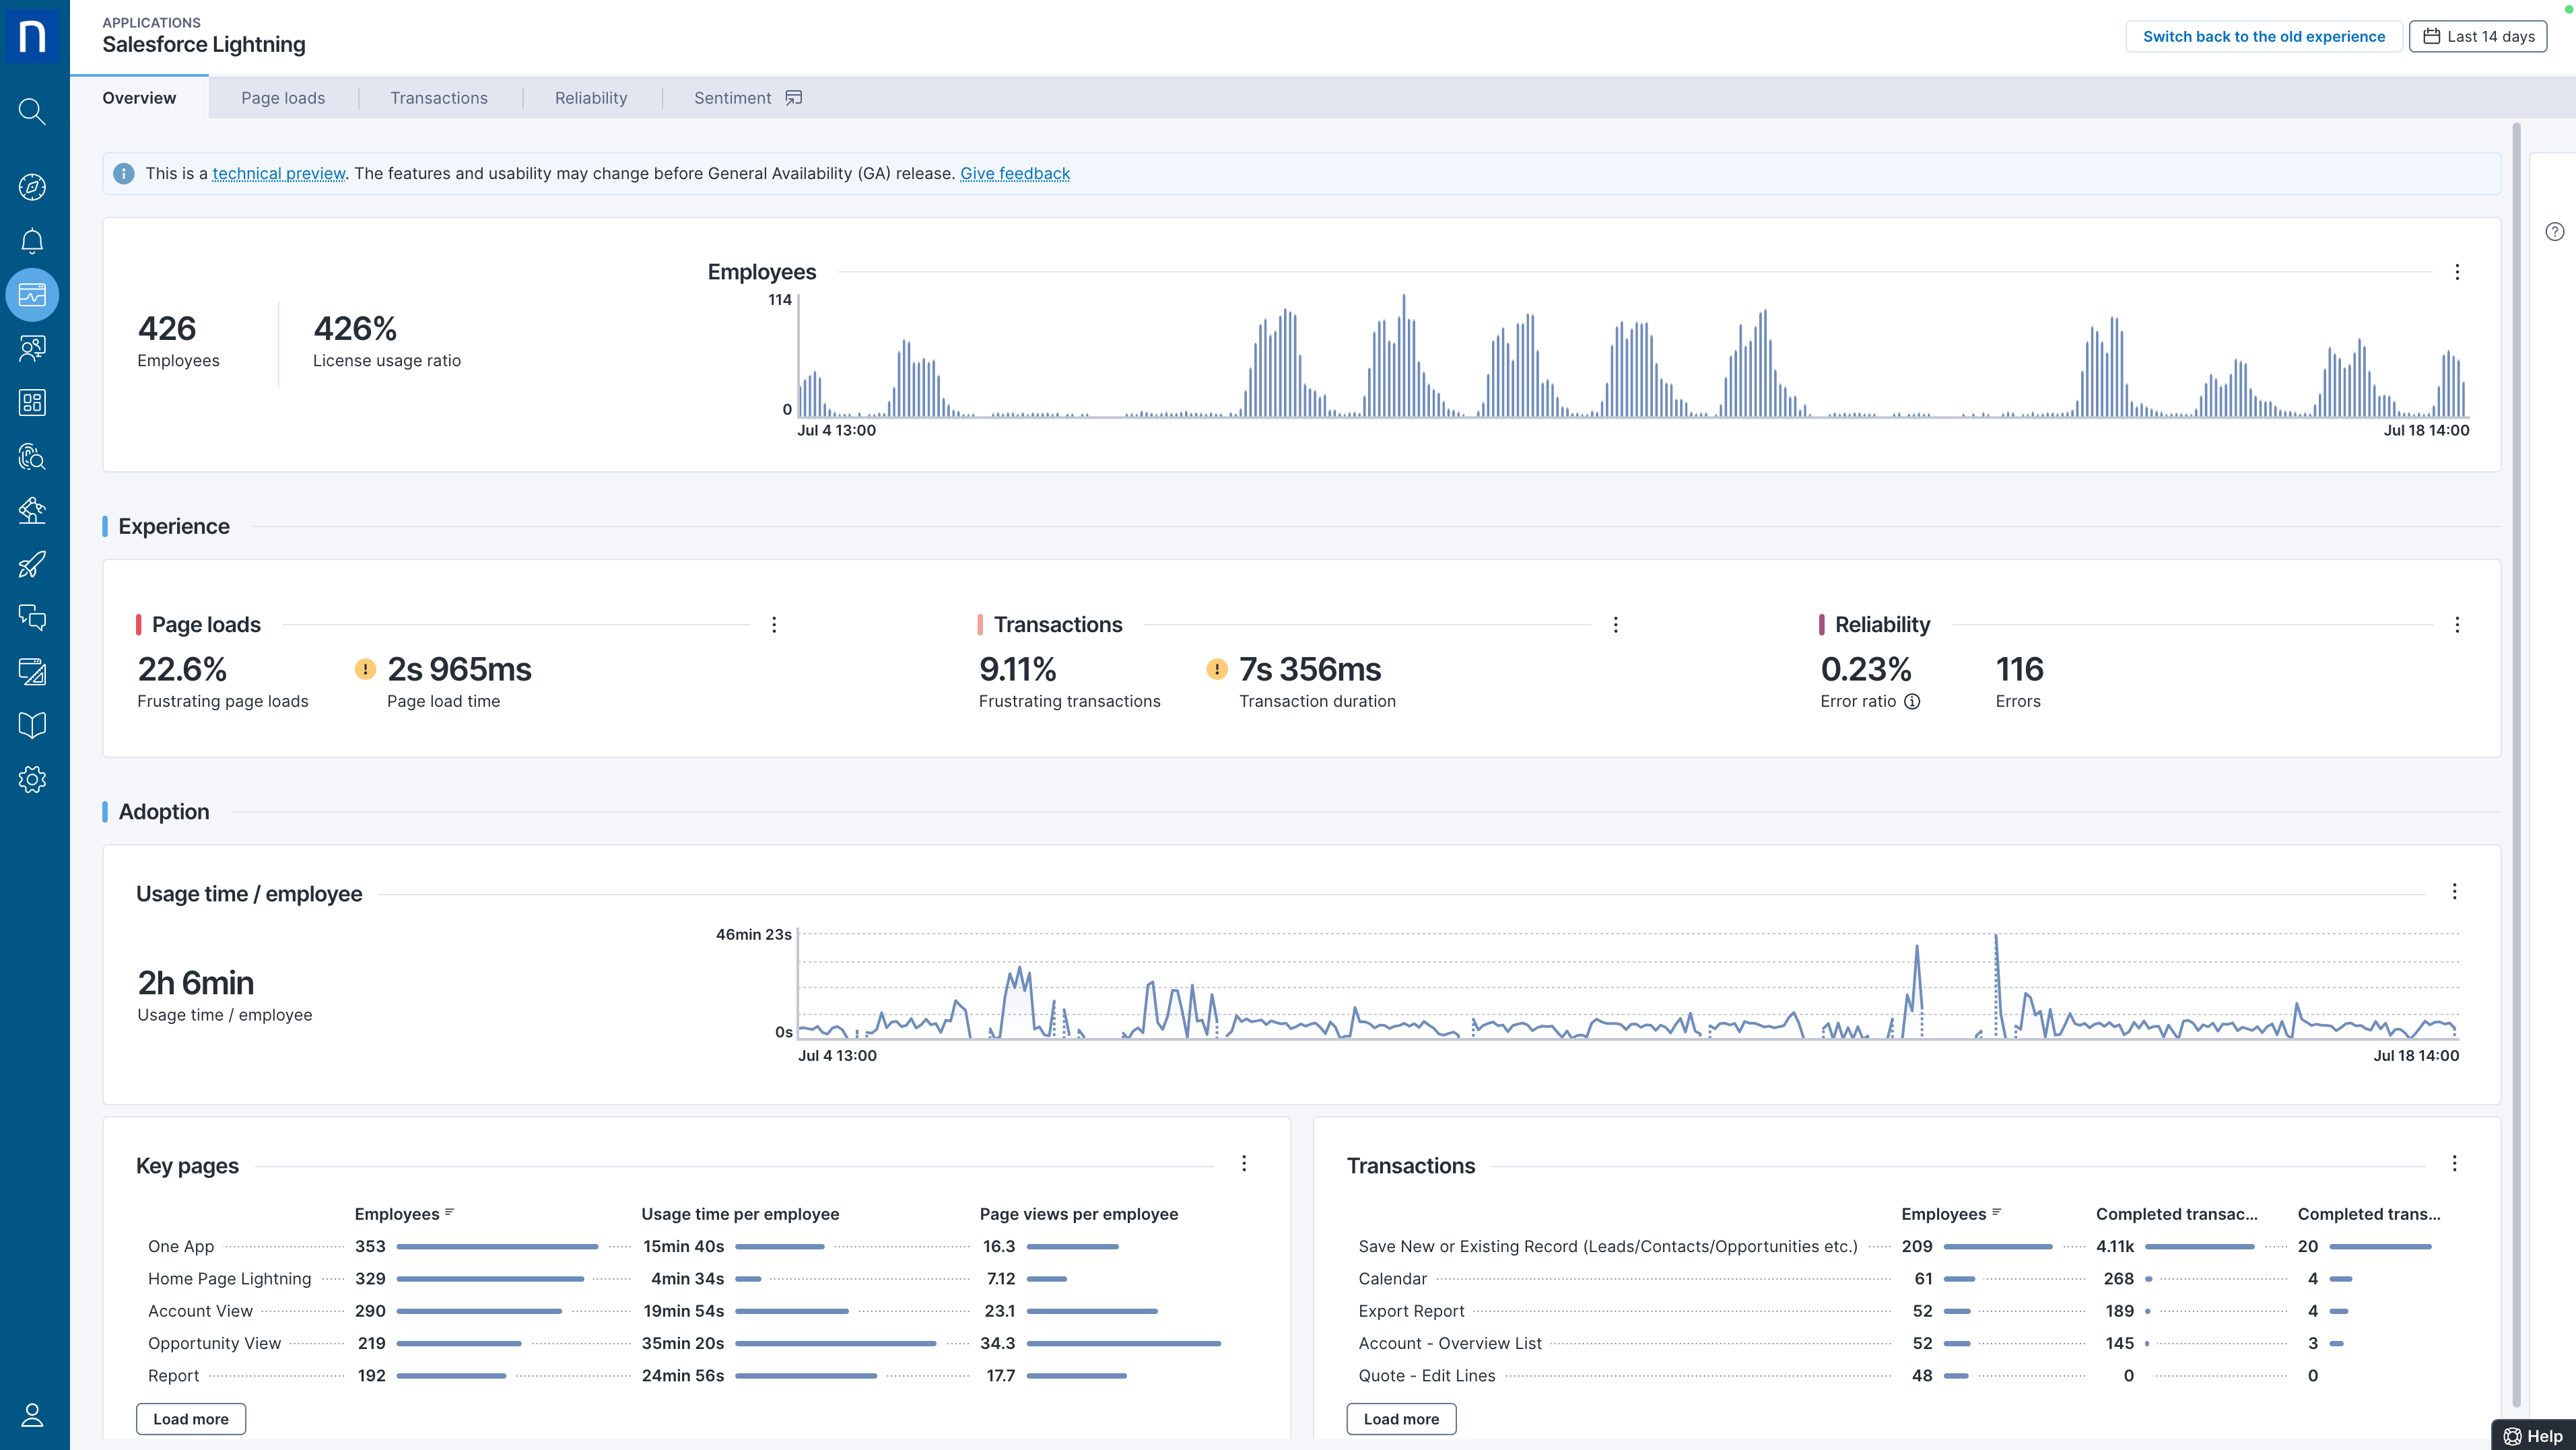
- All new Overview Dashboard
Replacing the previous Adoption Tab, we are now introducing an all-new “Overview tab” adding important application experiential context (e.g., “frustrating page loads”) to performance and adoption/usage information. This Overview rapidly reveals the key issues that demand attention, giving an actionable, impact-oriented top-level dashboard covering
time/performance, people, and productivity metrics.
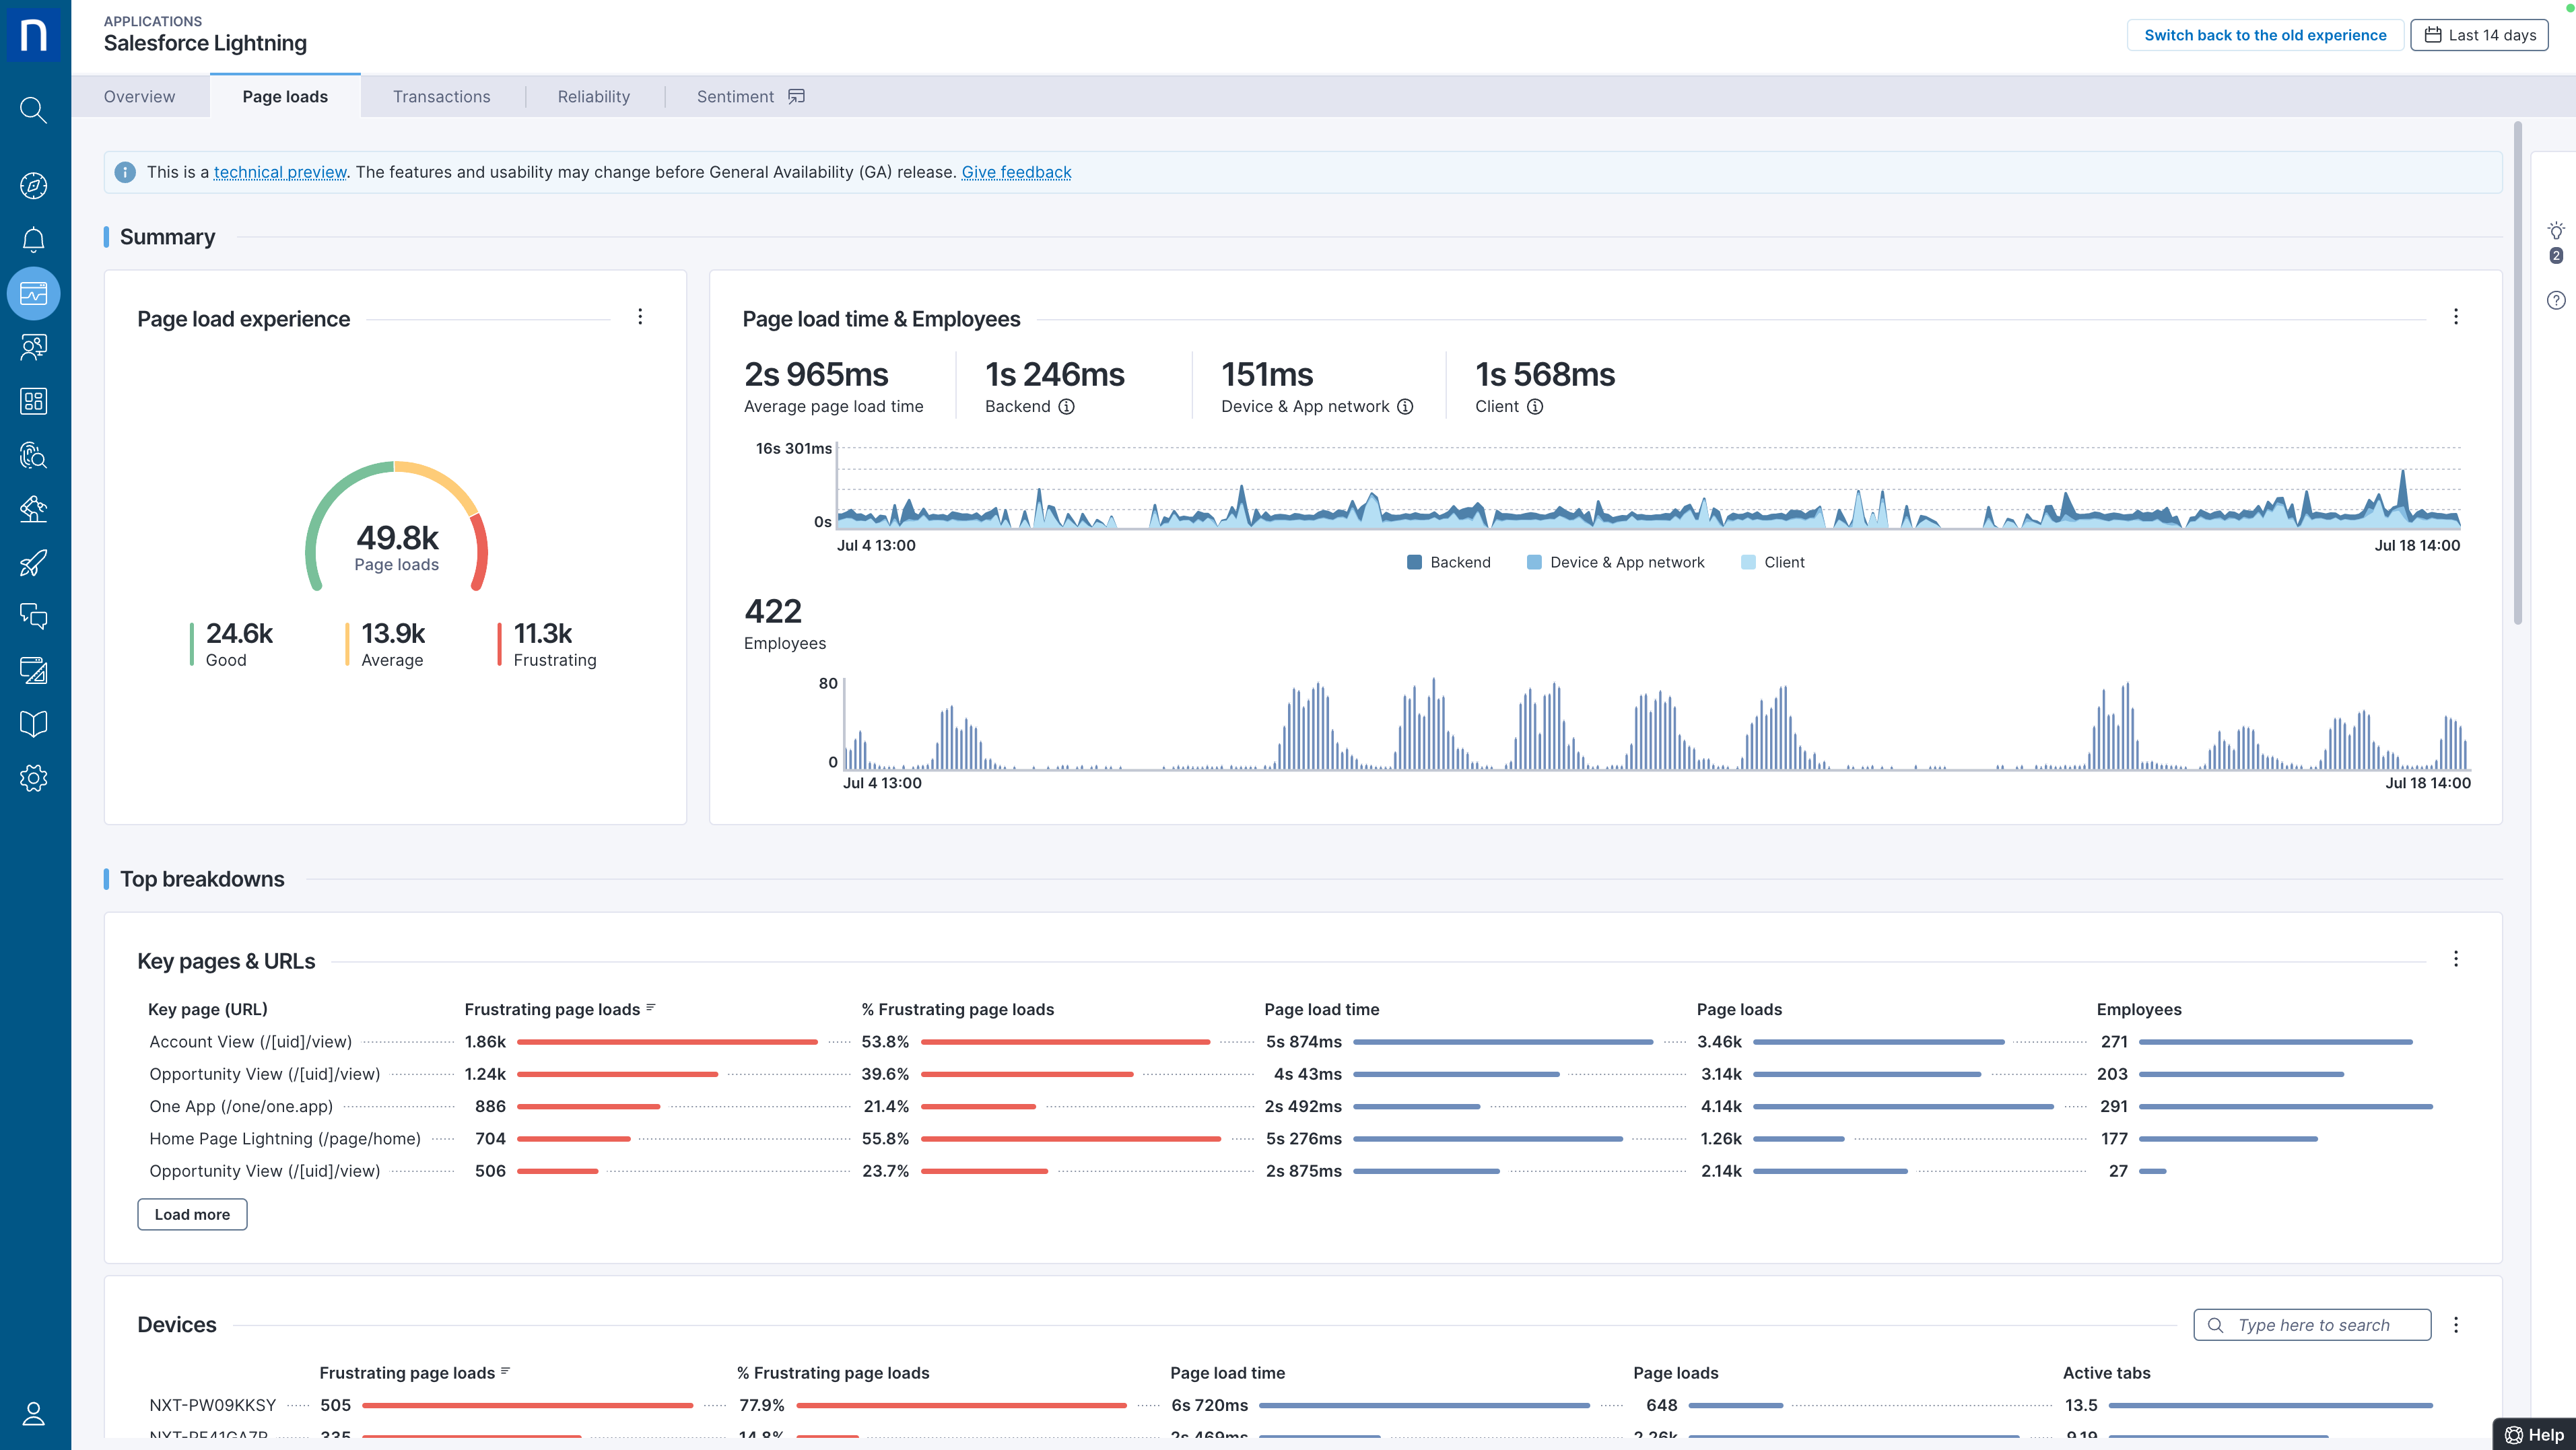
- New Page Loads dashboard
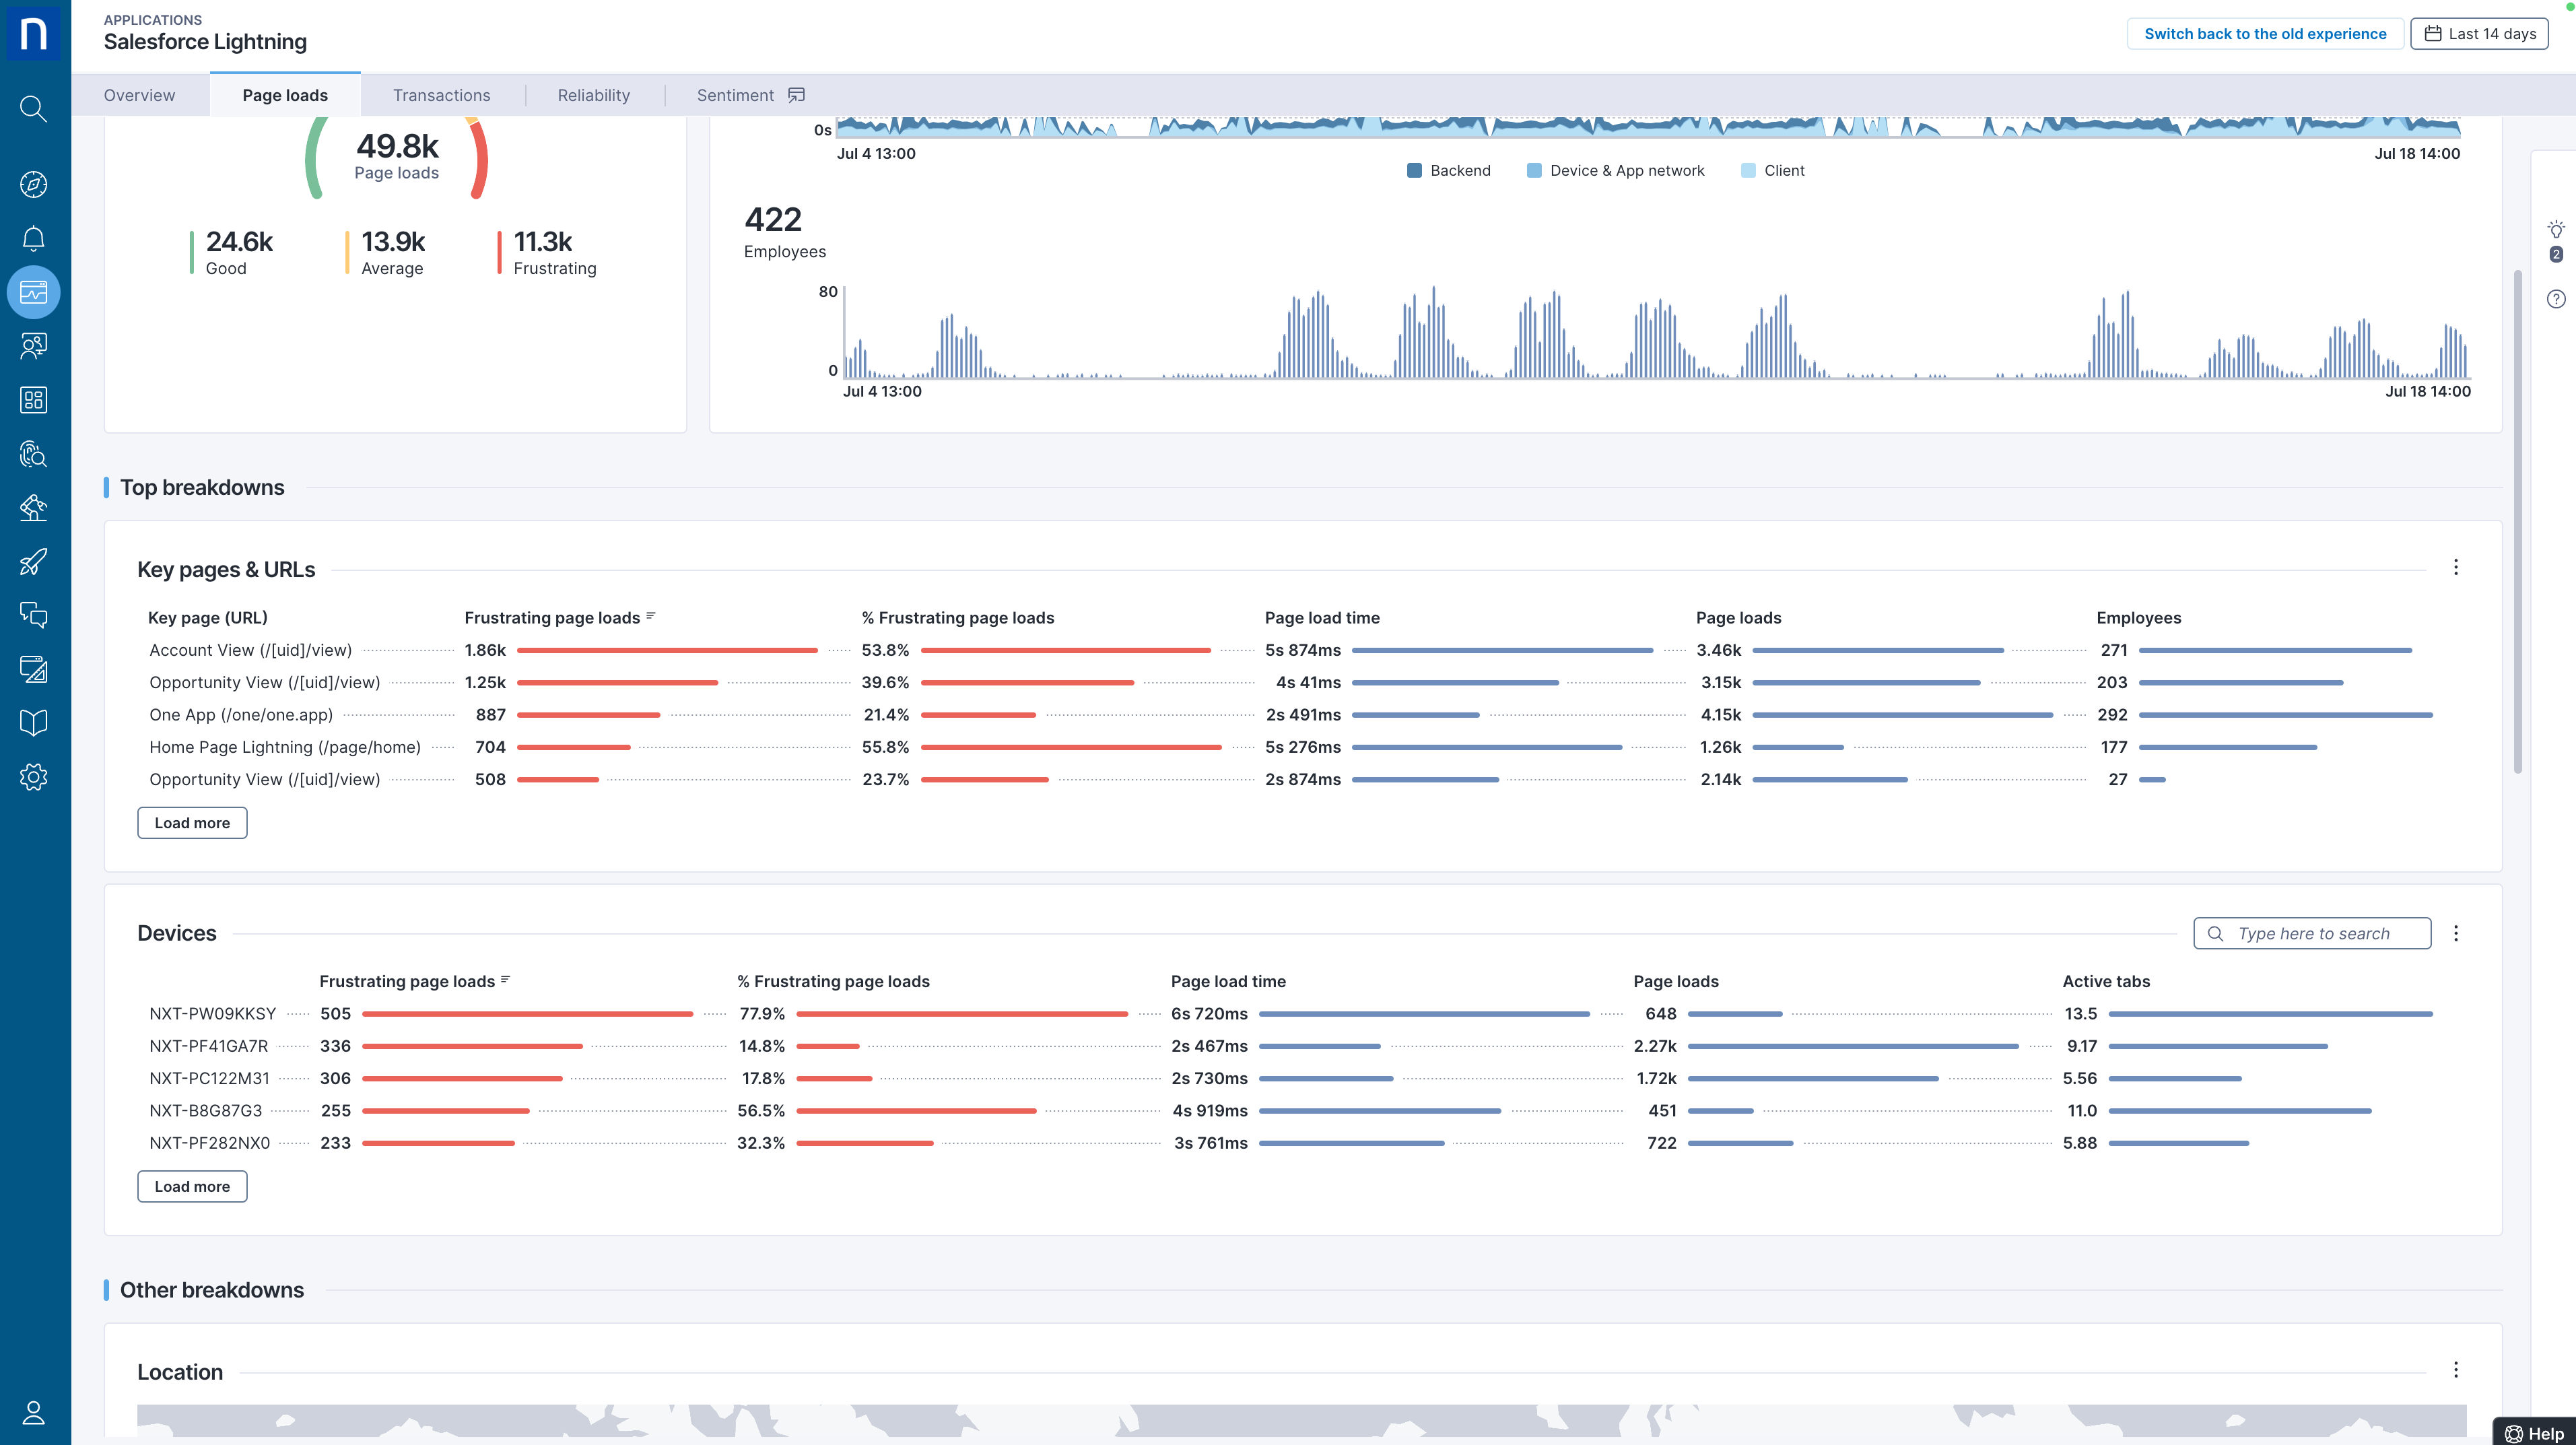
This dashboard can be thought of as a replacement for the previous “Troubleshoot” dashboard and starts with the leading metric being “Frustrating Page Loads” (the first column is “frustrating page loads”). After evaluation with our current customers, we found this metric to be instrumental in highlighting the pages or other dimensions that were causing the biggest issues.
We have also added to this dashboard a new column: "Active Tabs" under the device breakdowns (bottom right in dashboard below), for additional flexibility in diagnosing issues based on critical drivers of experience.
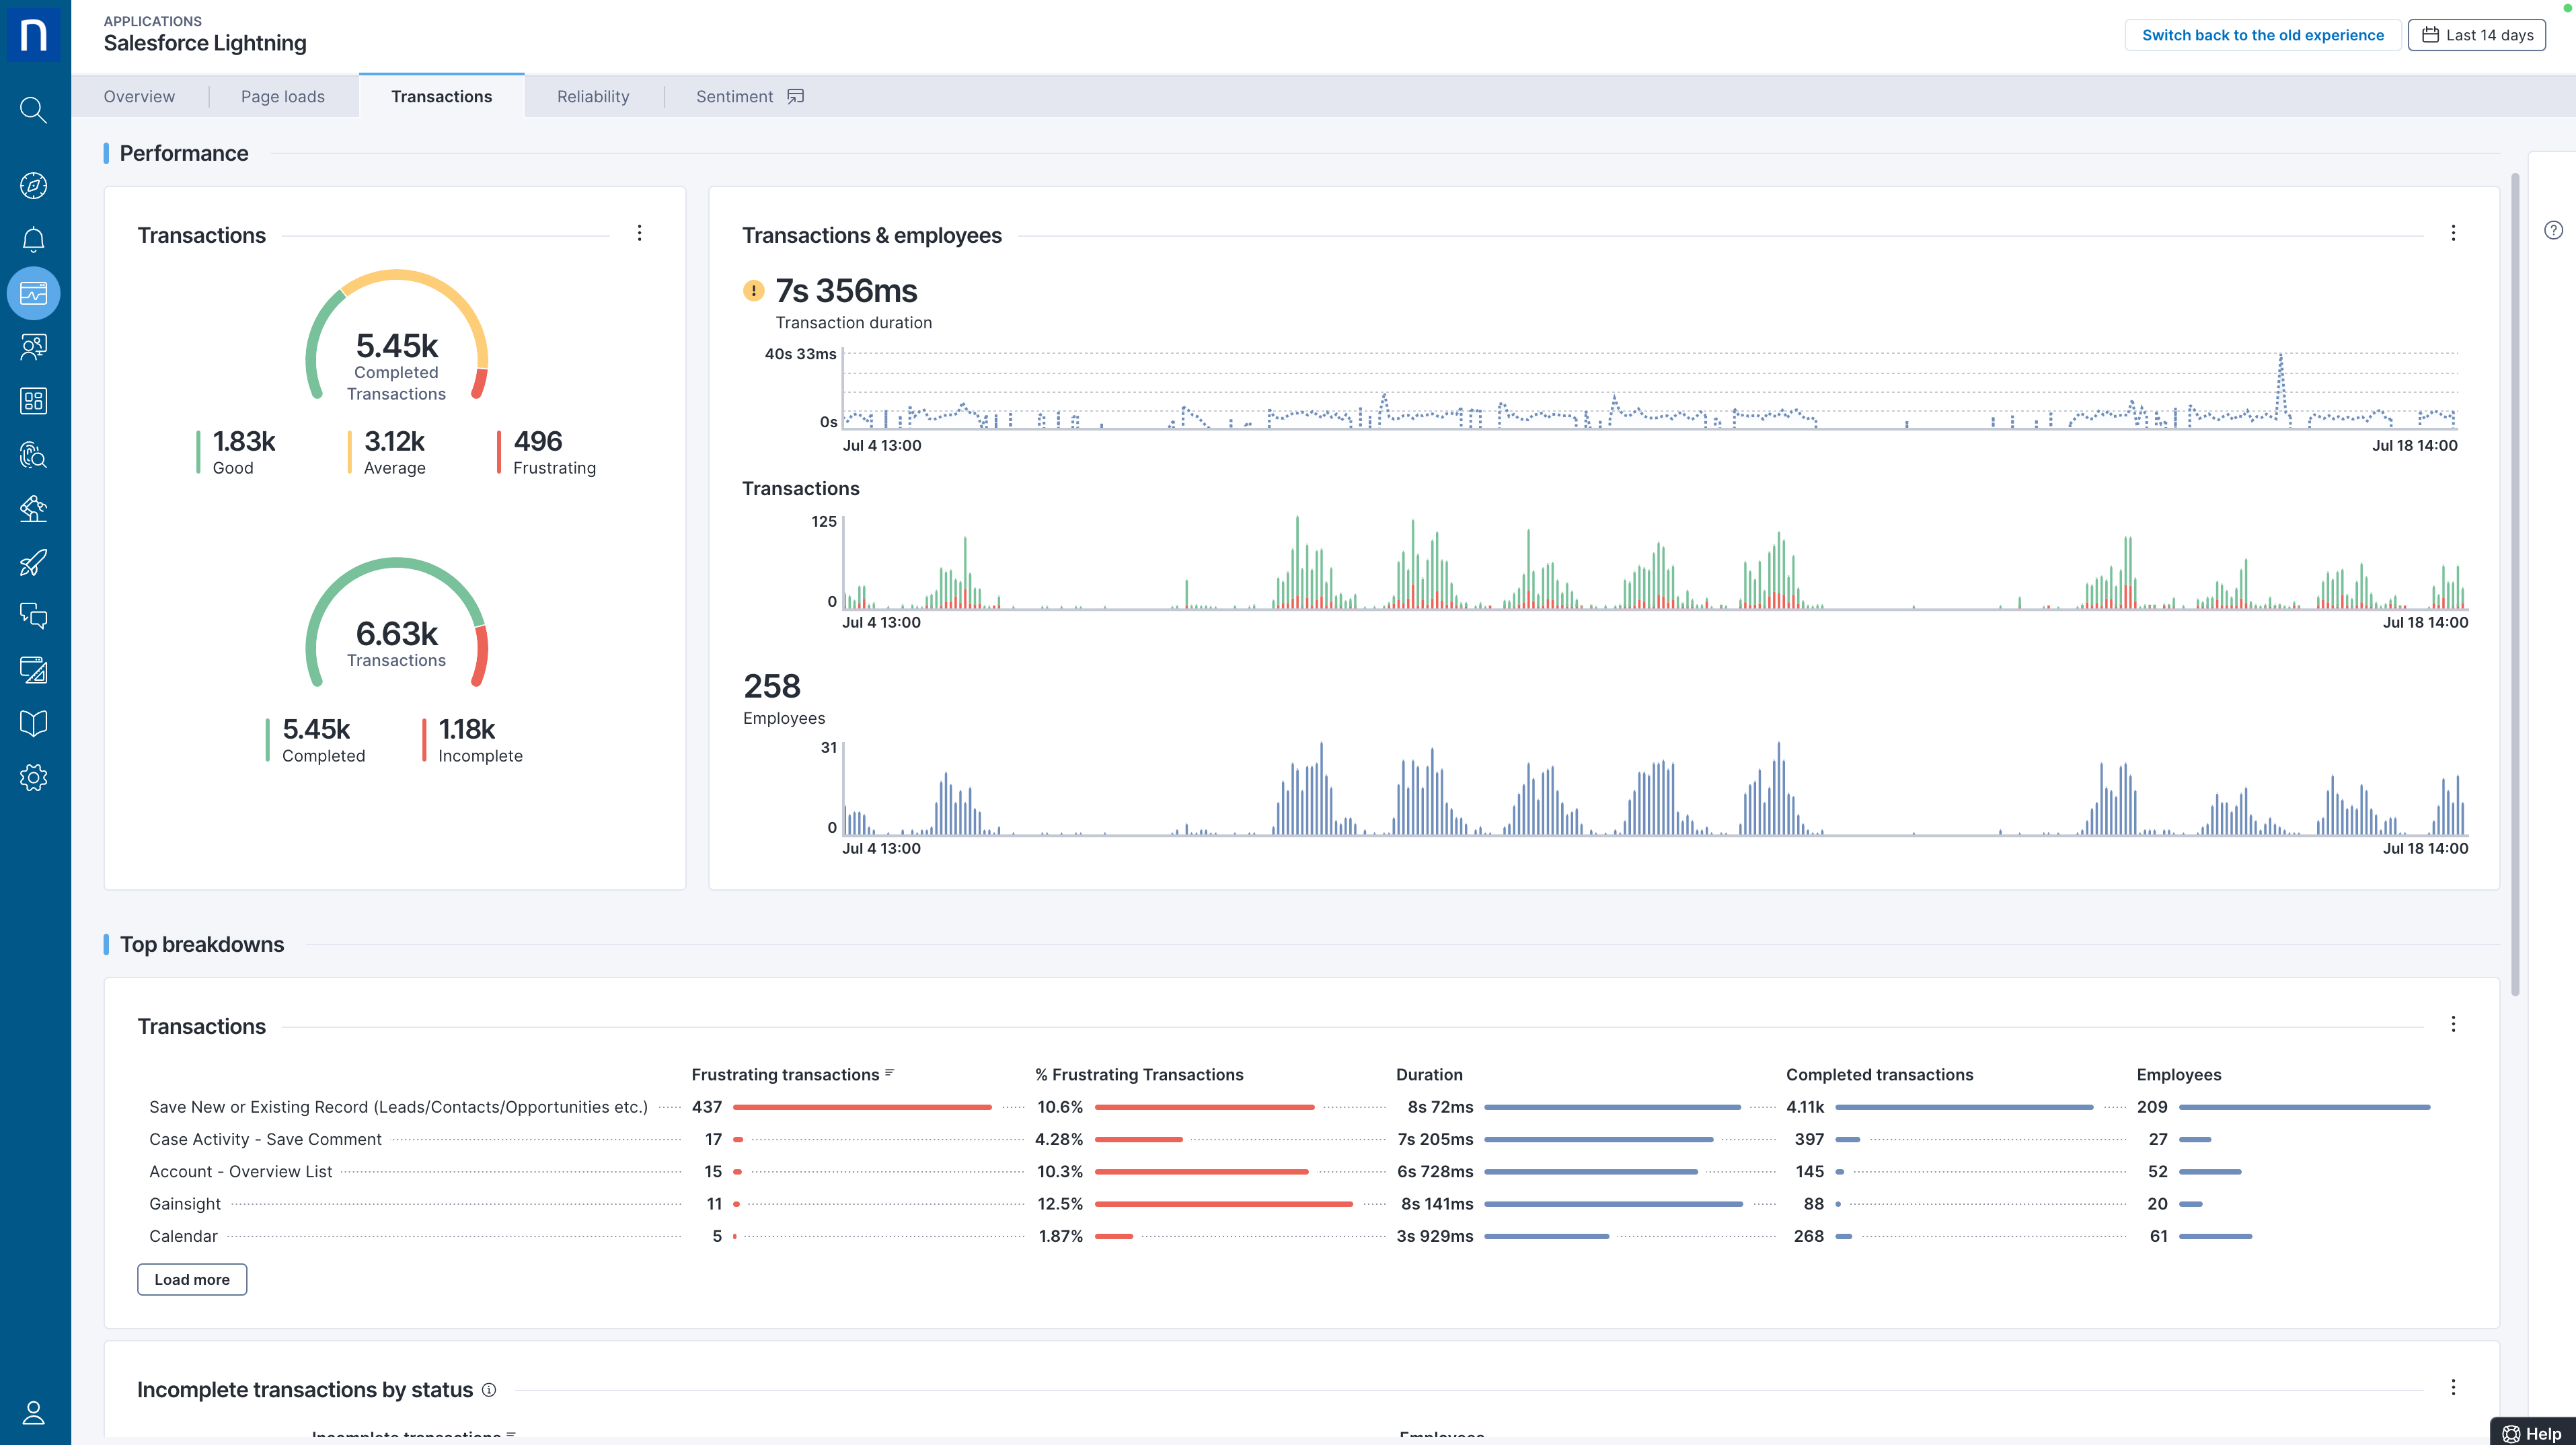
- New Transactions Dashboard
Continuing the theme of implementing improvements based on existing customer feedback, we have added two new gauge charts: Experience distribution of completed transactions, and distribution of completed/incomplete transactions; both again driven again by “frustrating transactions” ensuring alignment to user experience rather than purely technical performance metrics. We have also introduced an all-new breakdown on incomplete transactions.
- New Reliability Dashboard
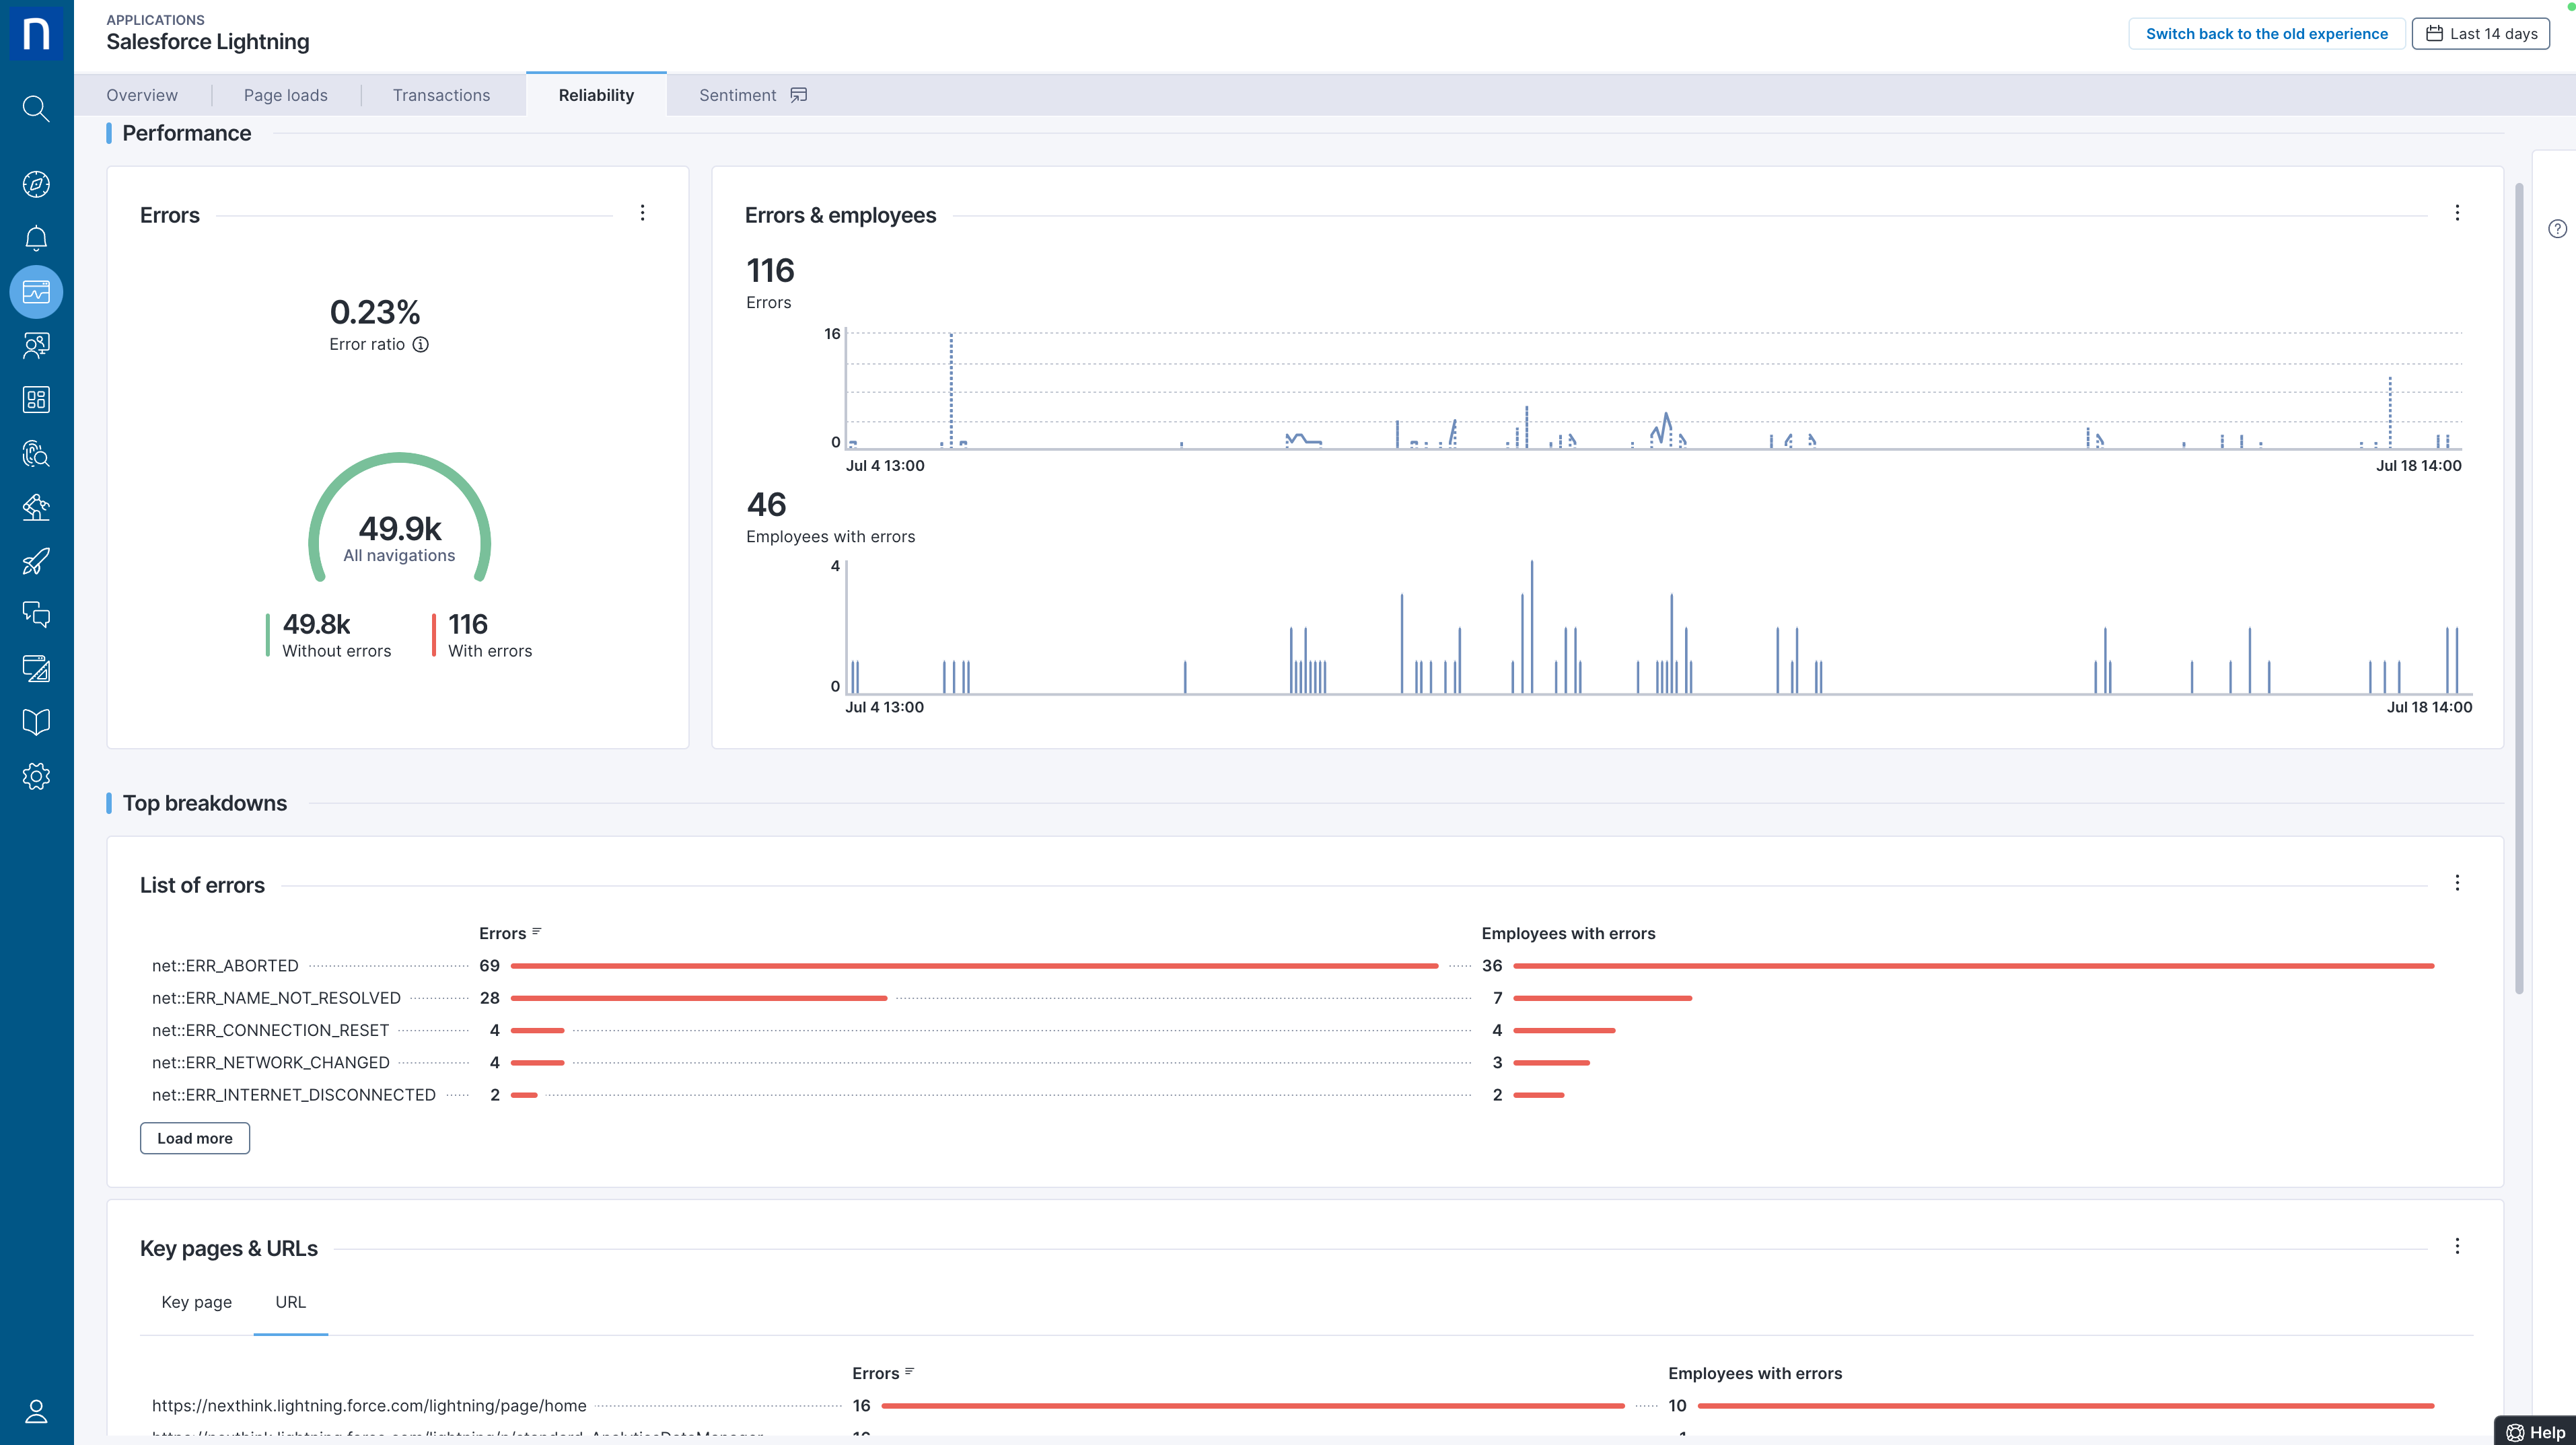
Completing the revamp, we have a new reliability dashboard with a new gauge chart (based on the more experiential metric “error ratio”). This ratio is calculated by dividing the number of errors by the total number of navigations, enabling rapid focus on the errors that matter most to employees' application experience.
Lastly, this new dashboard also supports error filtering on URLs using the URL breakdown.
Because accessing and using all of these new capabilities and dashboards is different from earlier versions of Application Experience, we are introducing them in Technical Preview now, and giving users the option to select between the current user experience and the new experience. The user merely toggles a selector in the product, located next to the date range selector at top right, next to the date range selector. We plan to allow this selectable option until later in 2024, when it will become the new default in-product.
4. Application Experience Support for View Domains
Because managing and optimizing applications typically spans multiple IT teams (e.g., EUC/Workplace, Desktop, Application teams, etc.) our customers have asked for the ability to restrict user access to specific applications and/or specific devices. With these changes,
Nexthink Administrators will now be able to grant “View Application” rights to Nexthink user profiles with limited view domains. Such limited views are useful to restrict access based on domains (e.g., restricting employees in a specific country from accessing/viewing data outside of that country – to meet compliance regulations such as GDPR). For a smooth experience, this has been implemented in the set of all-new NQL-based web dashboards as described above. For example, a user with a limited view domain can see desktop apps, network apps, and web apps. For web apps, these users will only see the new dashboards if they select the new experience.
As with the all-new main product dashboards described above, this choice is user-configurable using the “experience selector” in product, top-right.
Closing
It has been a scorching summer for Application Experience with the introduction of extremely powerful capabilities that in many cases and for most web applications can eliminate the need for expensive and complex APM tools. With many of these features fully generally available now, and the rest in technical preview and available before summer cools, customers should “jump in the Application Experience pool” today and experience the immediate relief of more value and easier use.
For more information, please visit: Nexthink Application Experience
